NodeBox: Data Visualisation Made in Belgium
On 26 September 2019 I gave a talk at Dataviz BXL, a data visualisation meetup organised by Digityser in Brussels, on an evening themed "data visualisation made in Belgium". I talked about NodeBox, the tool we build at Sint Lucas Antwerpen: where it comes from, how it works, and what people have made with it. This is a cleaned-up version of that talk, with the slides on the left.
I work at Sint Lucas Antwerpen, an art college where we teach painting, sculpture, photography, graphic design, advertising and illustration. Because it is an academic institution it also does research, and that is where I work, in a research group called EMRG. We develop NodeBox.
NodeBox 1
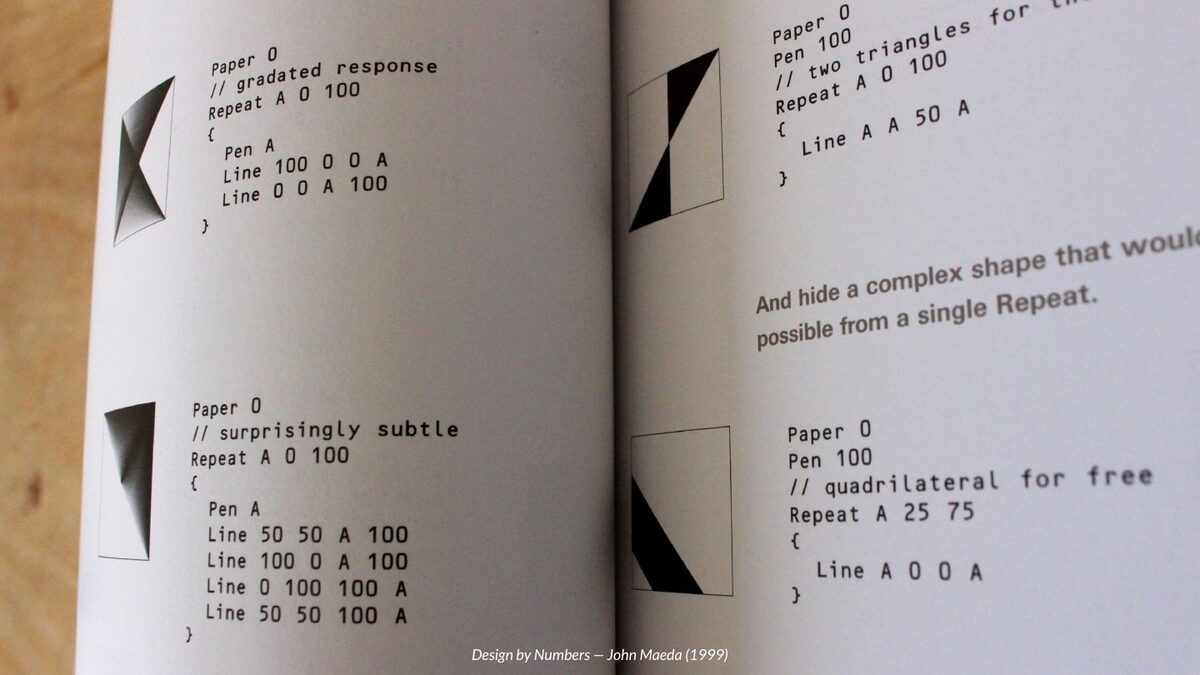
NodeBox started from software like John Maeda's Design by Numbers (1999), made to teach programming to designers. You write very small programs that draw into a square of 100 by 100 pixels. It is an imperative way of programming: each line is a command that does something.
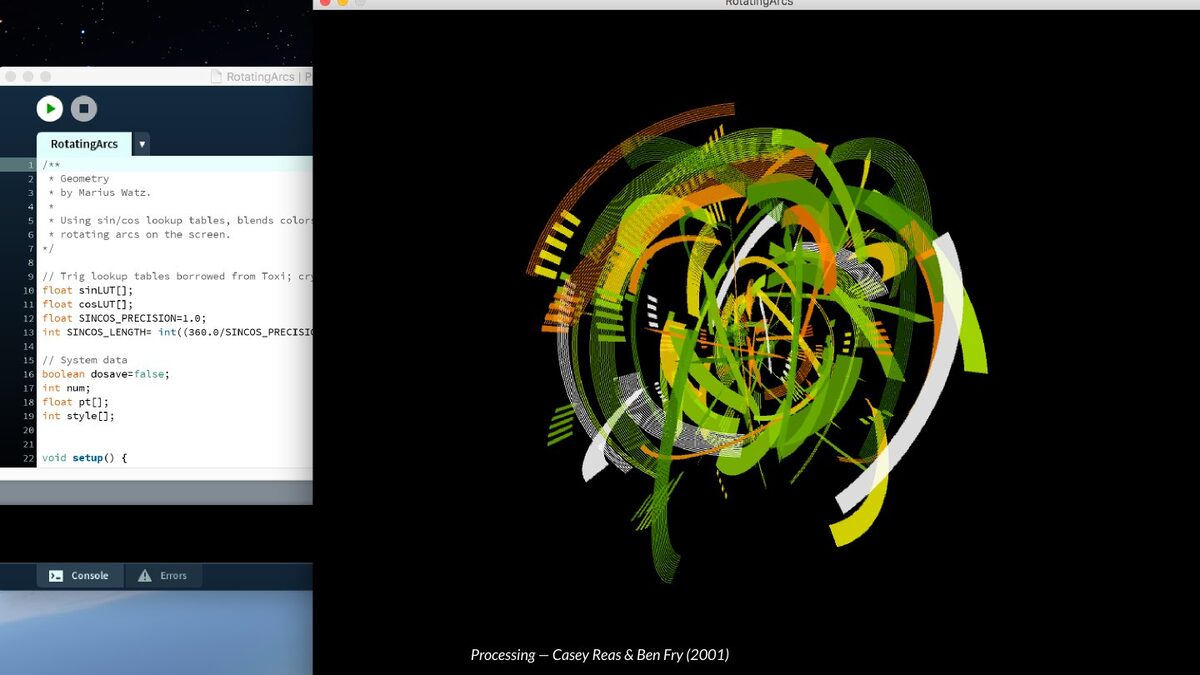
Processing, by Casey Reas and Ben Fry, grew out of the same ideas, and we started NodeBox around the same time.
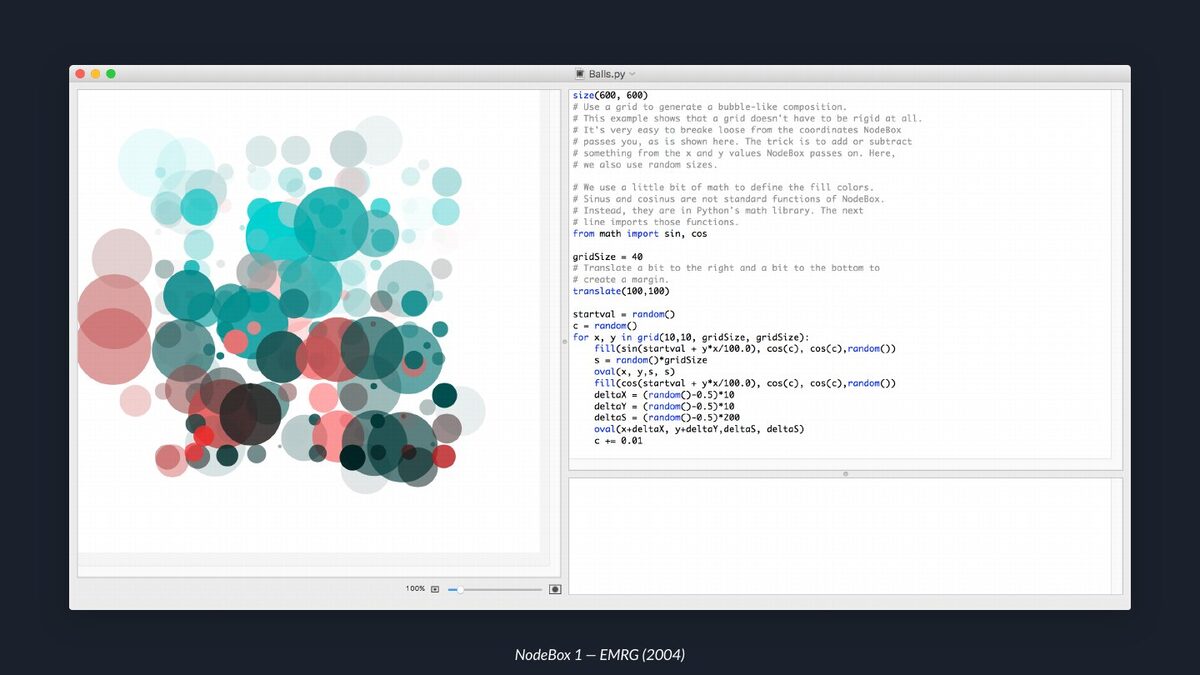
NodeBox 1 (2004) works much like Processing. It was built on DrawBot by LettError, which is still active today. The visuals are on one side, the code on the other, and the errors at the bottom, which is where you look most of the time.
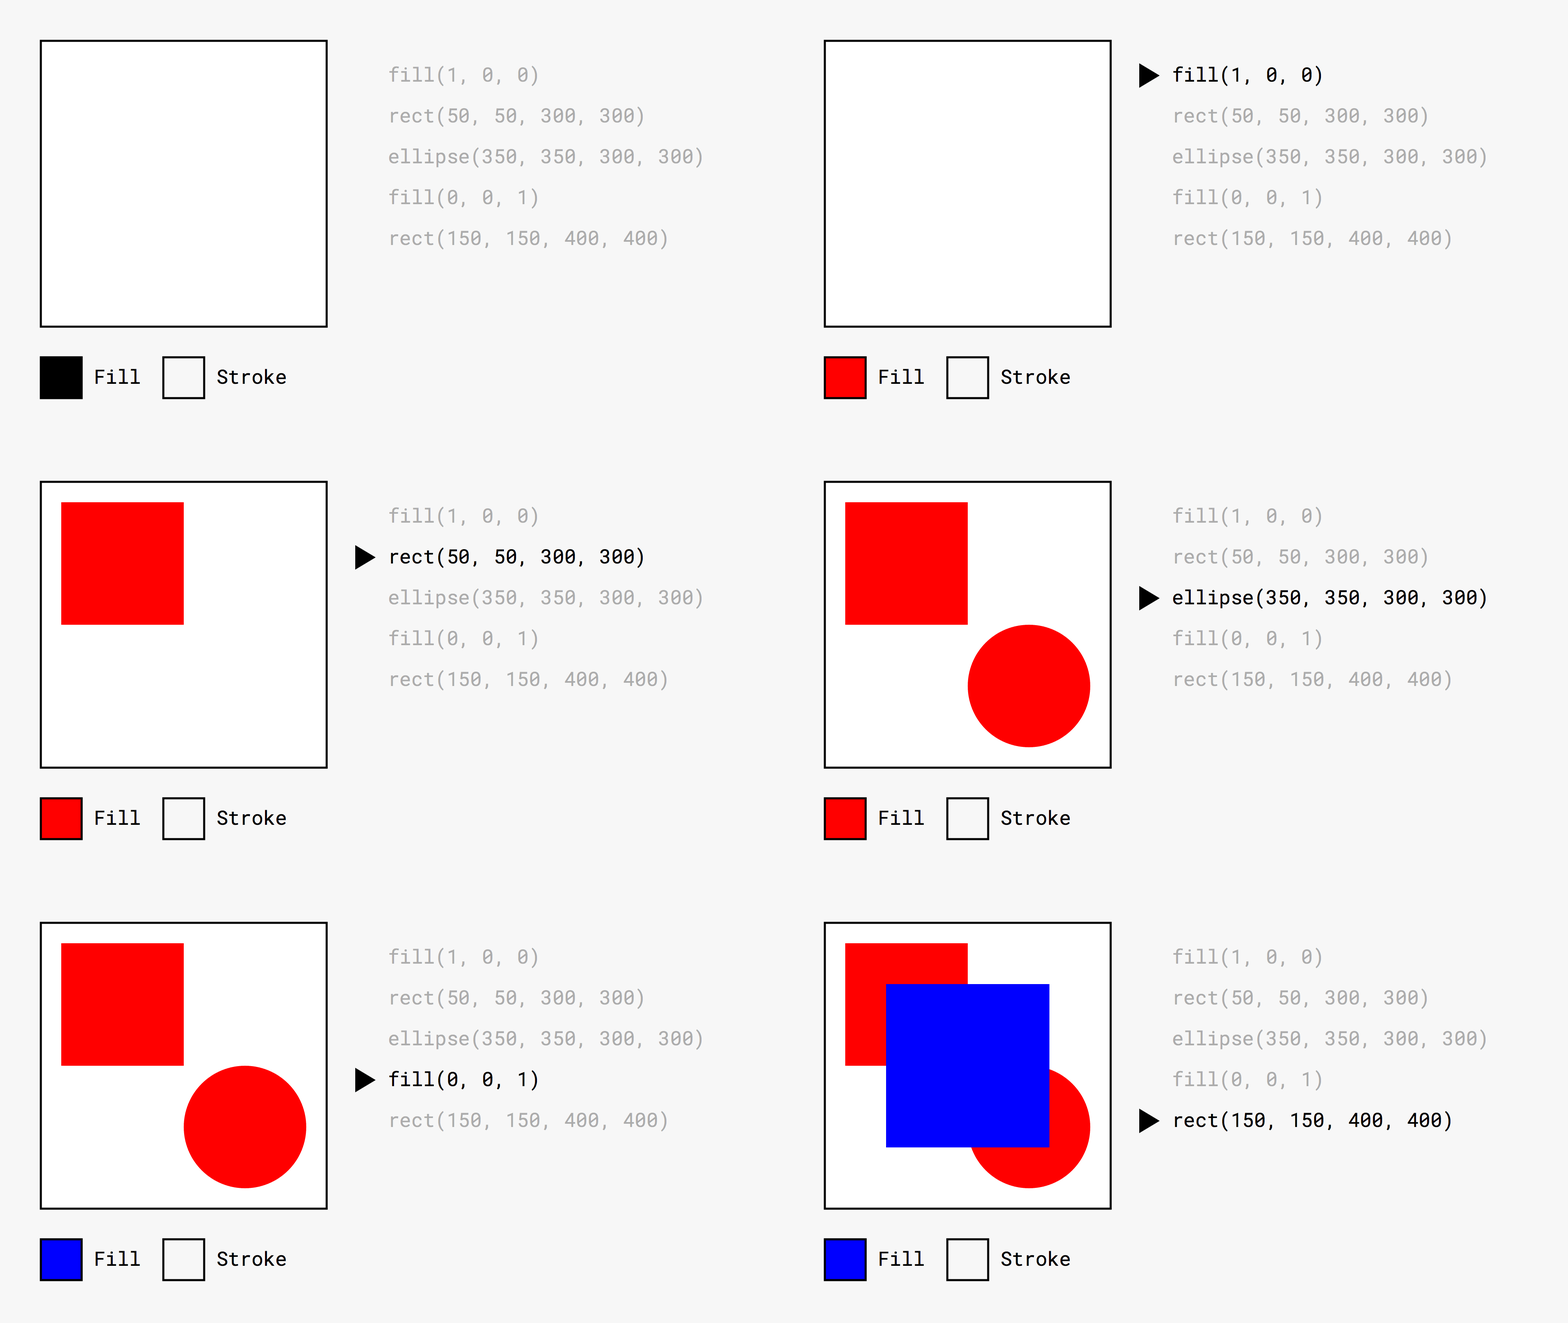
You type a command and it gets painted. This is called the painter's model, and you know it if you have worked with Canvas or OpenGL. A command sets some state, such as the fill colour, and the drawing commands after it use that state.
It works well, but you have to keep the state of the program in your head at every point. If you copy a few lines to another place and forget the fill line, the result changes.
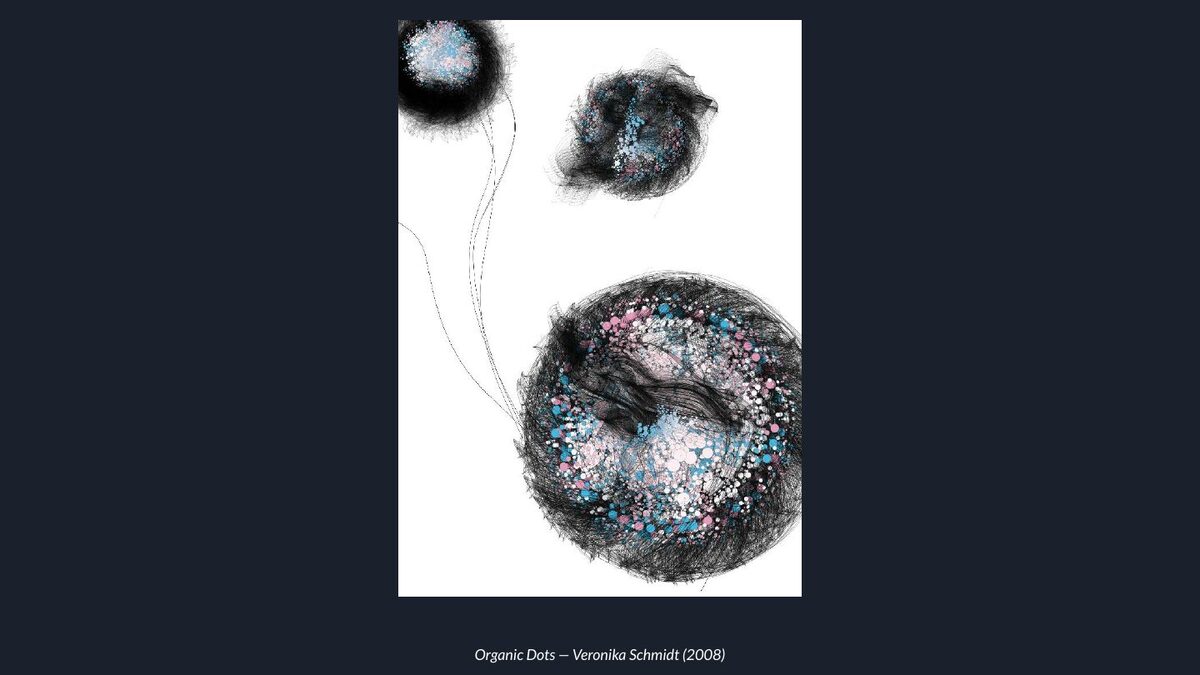
We run a lot of workshops with this software, and none of the students are programmers. They draw basic shapes in Illustrator or elsewhere, bring them into NodeBox and start manipulating them. Organic Dots by Veronika Schmidt is an example. These are generative designs rather than data visualisations, and the only data in them is random.
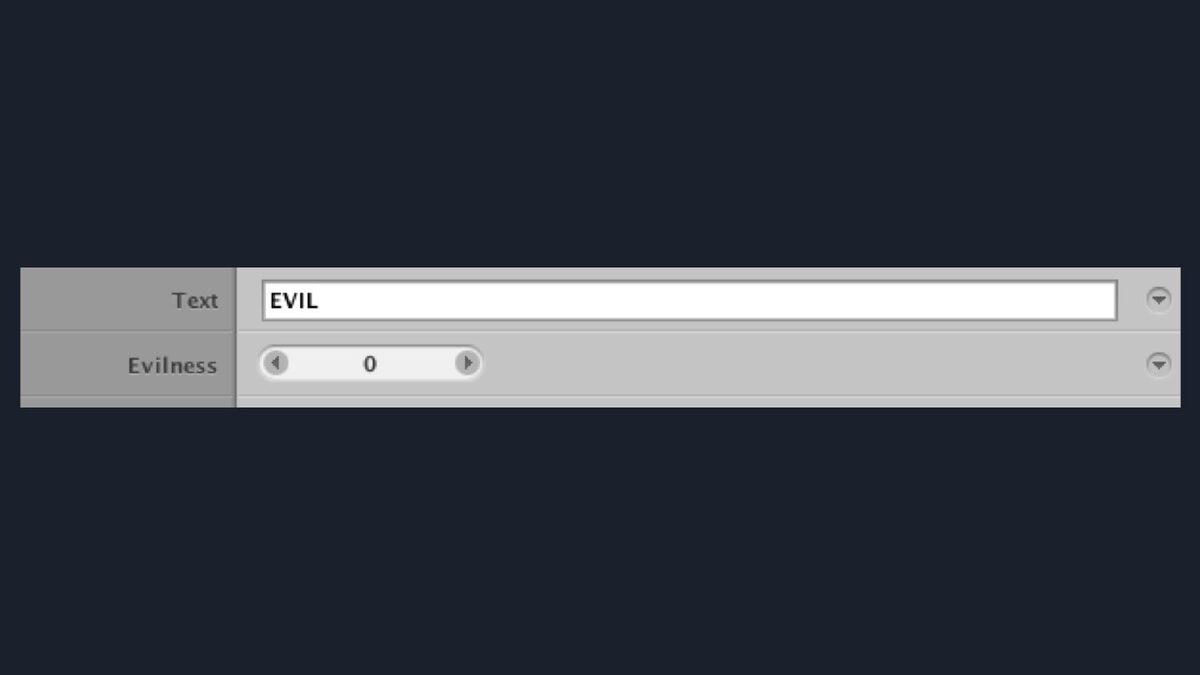

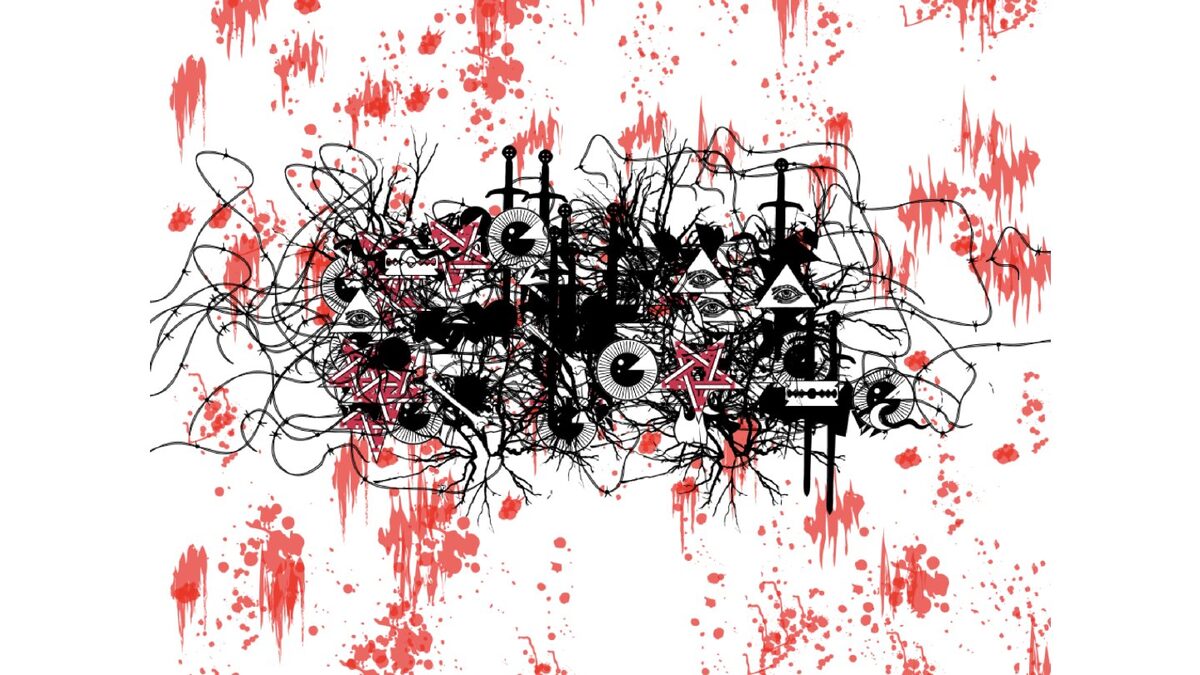
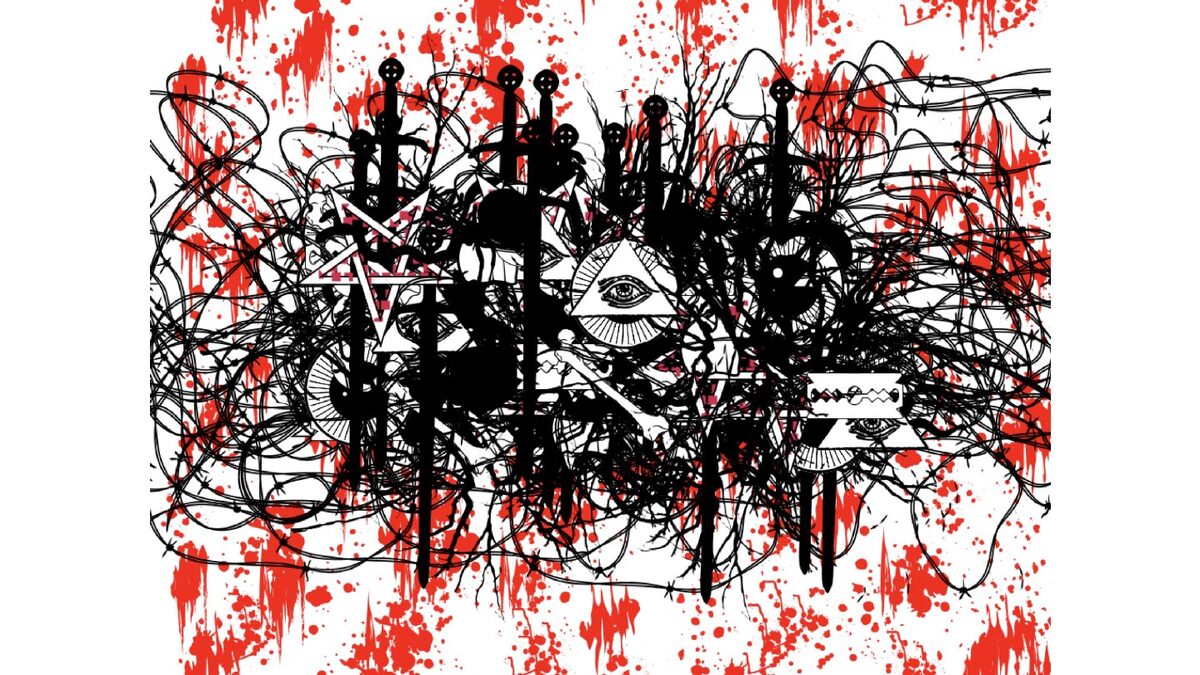
Some of these programs do take input. The Evil Font by Valtteri Vitakoski is a generative typeface with one parameter, evilness. At zero it is a plain sans serif. Add some evil and the letters start sprouting thorns, eyes and swords, until at full evilness the word disappears under them.
What I like about it is that this slider is not one you will find in Illustrator. Students invent their own parameters, make a slider for them, and connect it to whatever they want. People who work in data visualisation know this idea well, but it is still good to see students discover it.
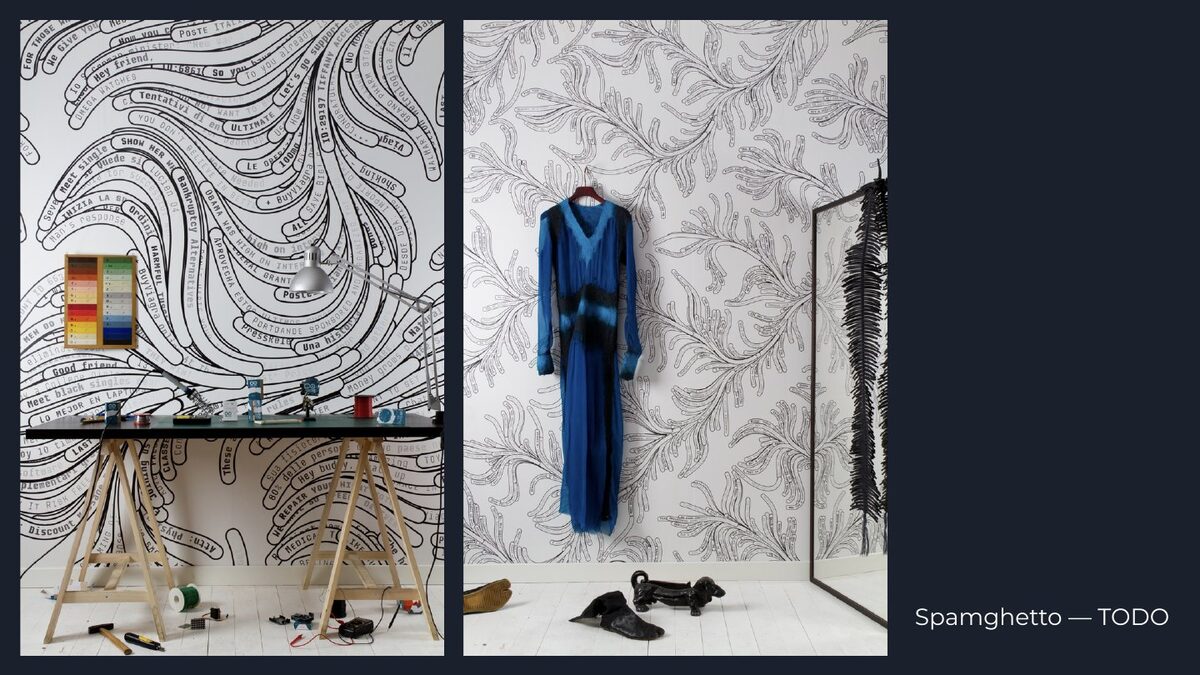

Spamghetto, by the Italian design studio TODO, takes the spam in your mail folder and turns it into wallpaper. You can send them your own spam and they run their NodeBox script on it to make a personal pattern. In the close-up you can read a mail "from the desk of the president of Trump University".
NodeBox 3
The biggest problem with NodeBox 1 turned out to be the programming. Many of the people we teach are graphic designers and illustrators who have no background in programming and are not much interested in it. We tried teaching them, and it works for some people but not for everybody.
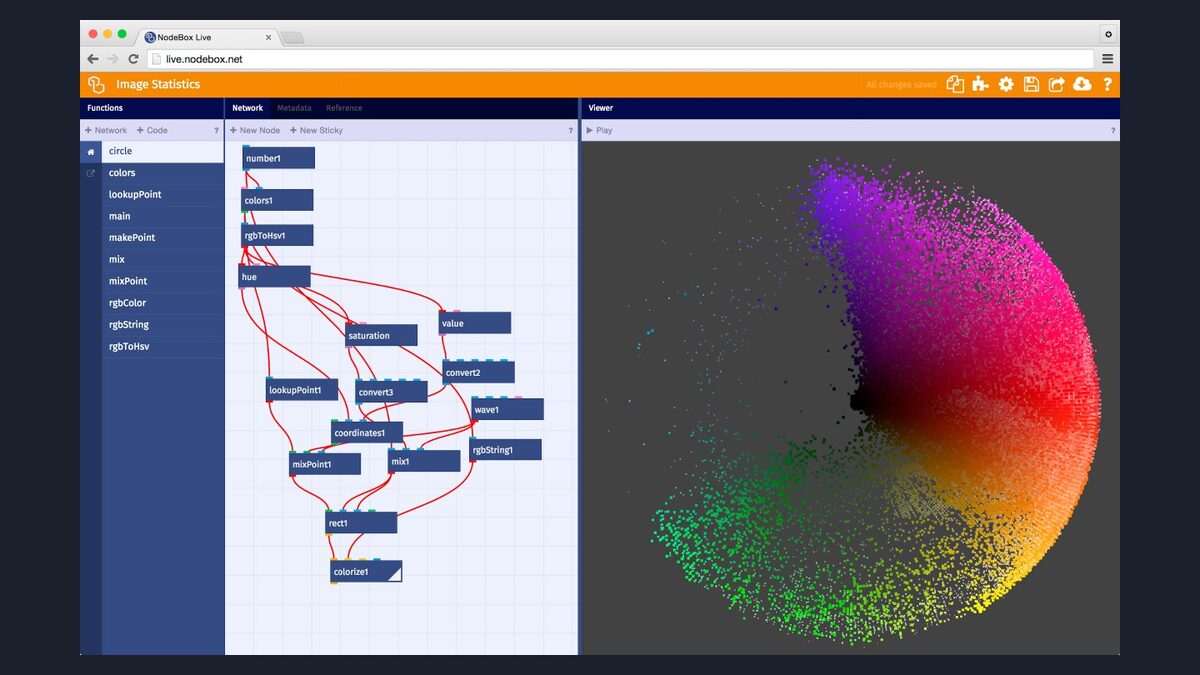
So we tried to turn the model around, and that became NodeBox 3. It is a visual application that requires no programming. You build a visualisation from small building blocks, which we call nodes, and each node does one part of the work. (This screenshot is of NodeBox Live, the later web version, which I come back to below.)
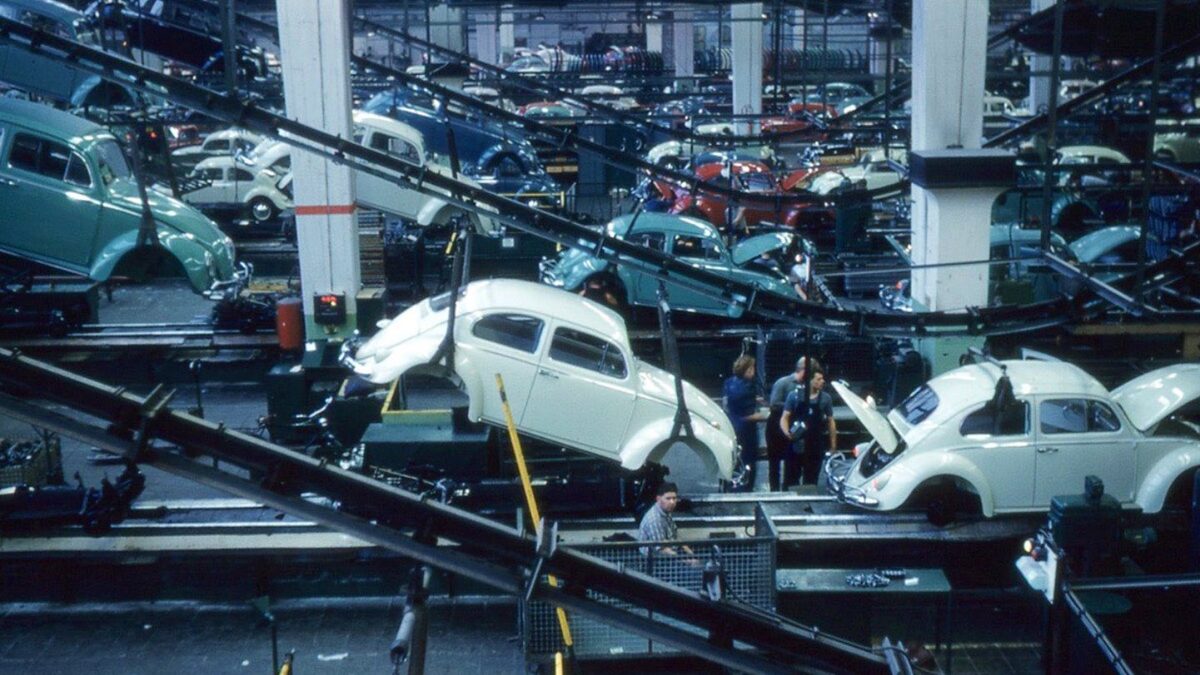
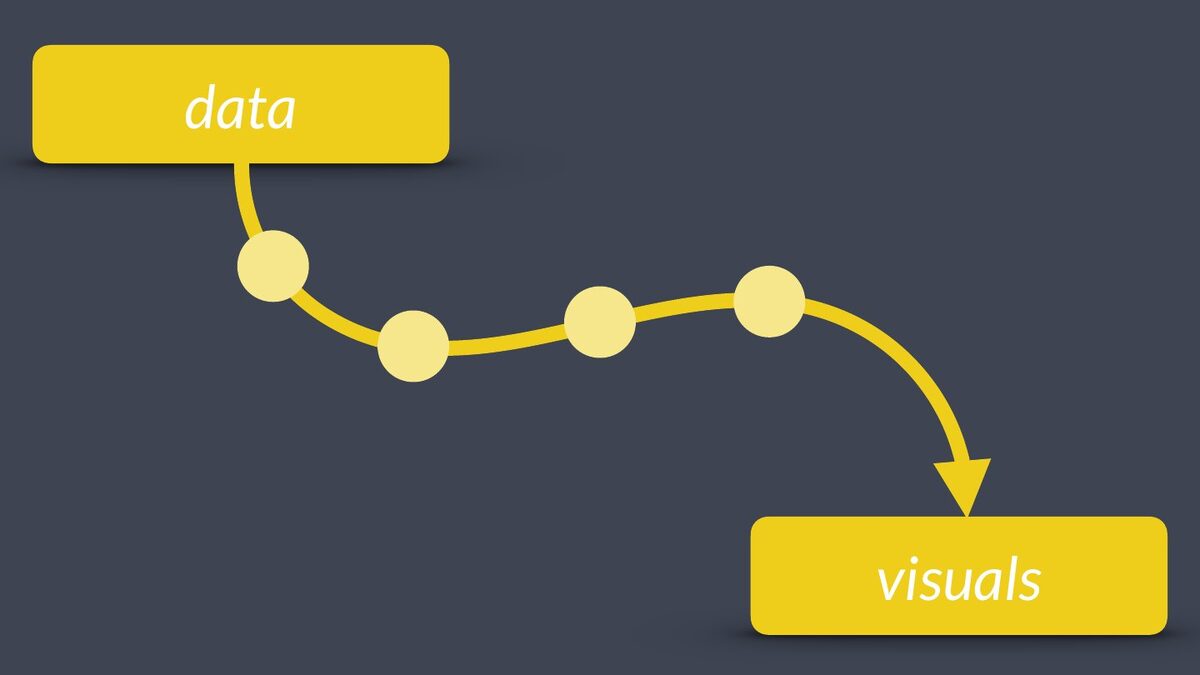
Think of a factory assembly line. The cars move down the line and every station does one part of the job.
We are going from data to visuals instead of building cars, and there are intermediate steps on the way. We process the data until it has the right shape. At some point we turn a value into a visual property: the width of a bar in a bar chart, the radius of a circle, a position on a map after a projection.
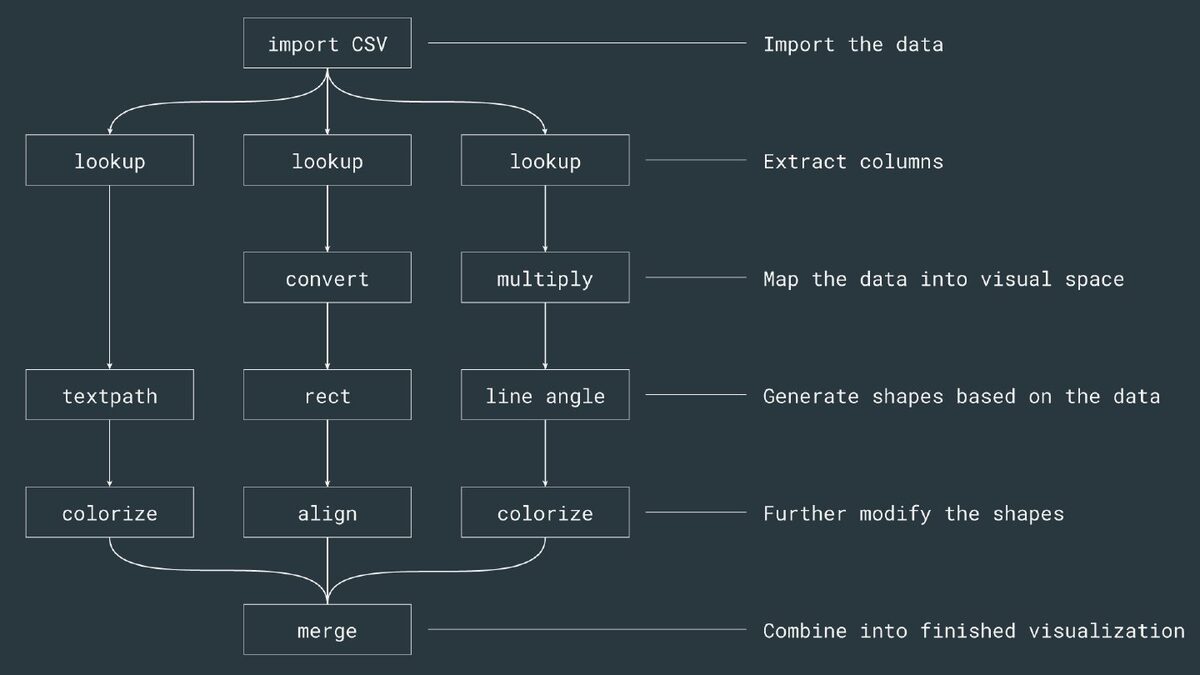
Here is a simple network. We import a CSV file, and lookup nodes extract the columns we need. The data is rarely in the form we want, so we convert it: we change the range from millions to pixels, or simply multiply. Then we generate shapes from the data, such as text on a path, rectangles or lines, and modify them further by aligning or colouring them. A merge node combines everything into the finished visualisation.
The whole application uses this one consistent system, which makes it easy to learn.
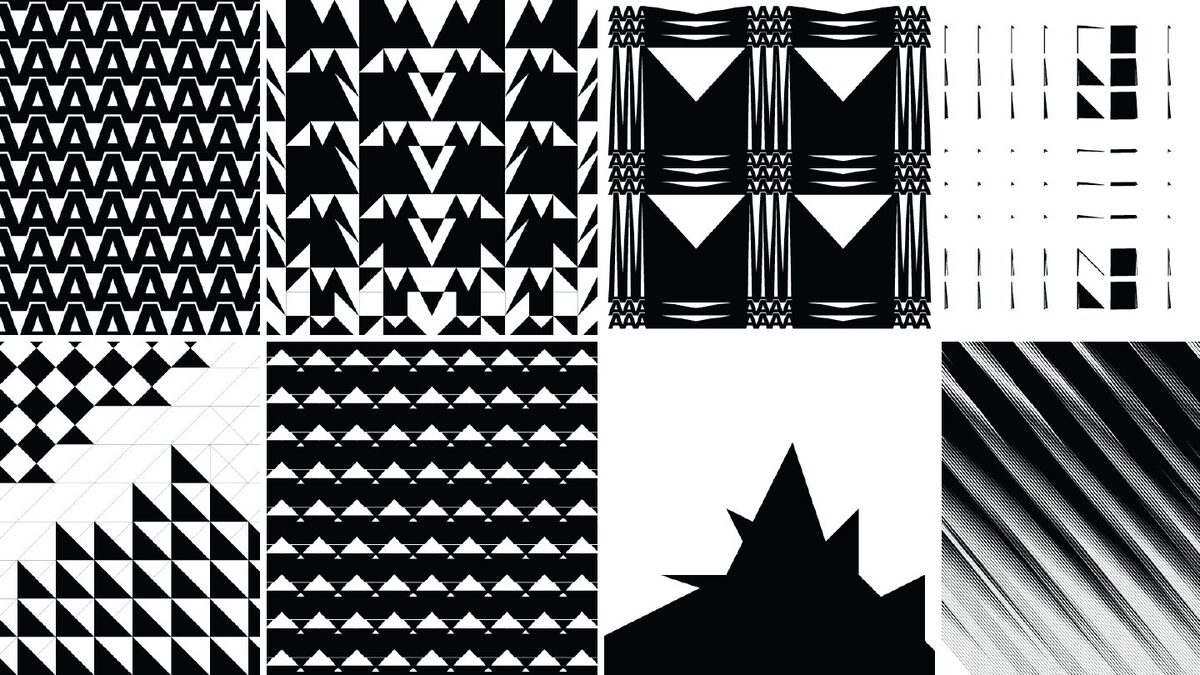
You don't need to understand the whole process to use it. You can take an existing NodeBox file and start changing its parameters without touching its structure. All of these designs come from the same network; only the parameter values differ.
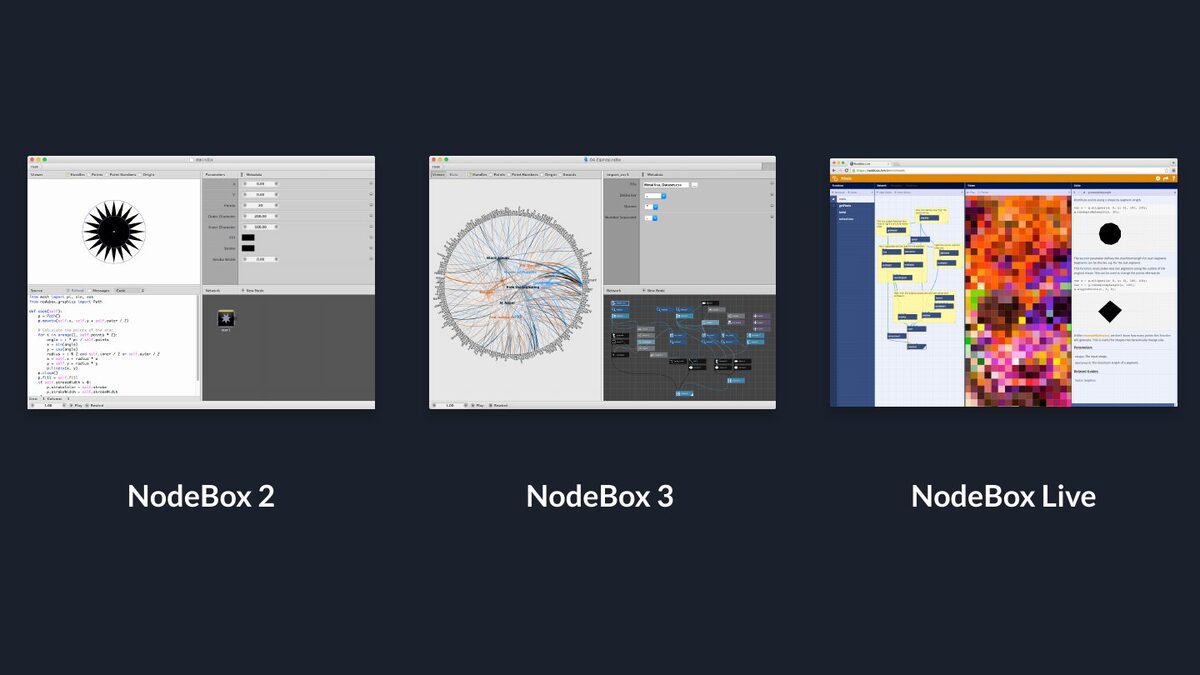
There have been several versions. NodeBox 2 worked quite differently and is no longer supported. NodeBox 3 and NodeBox Live share the same evaluation model. NodeBox 3 is an open source desktop application, and NodeBox Live runs in the browser.
Examples
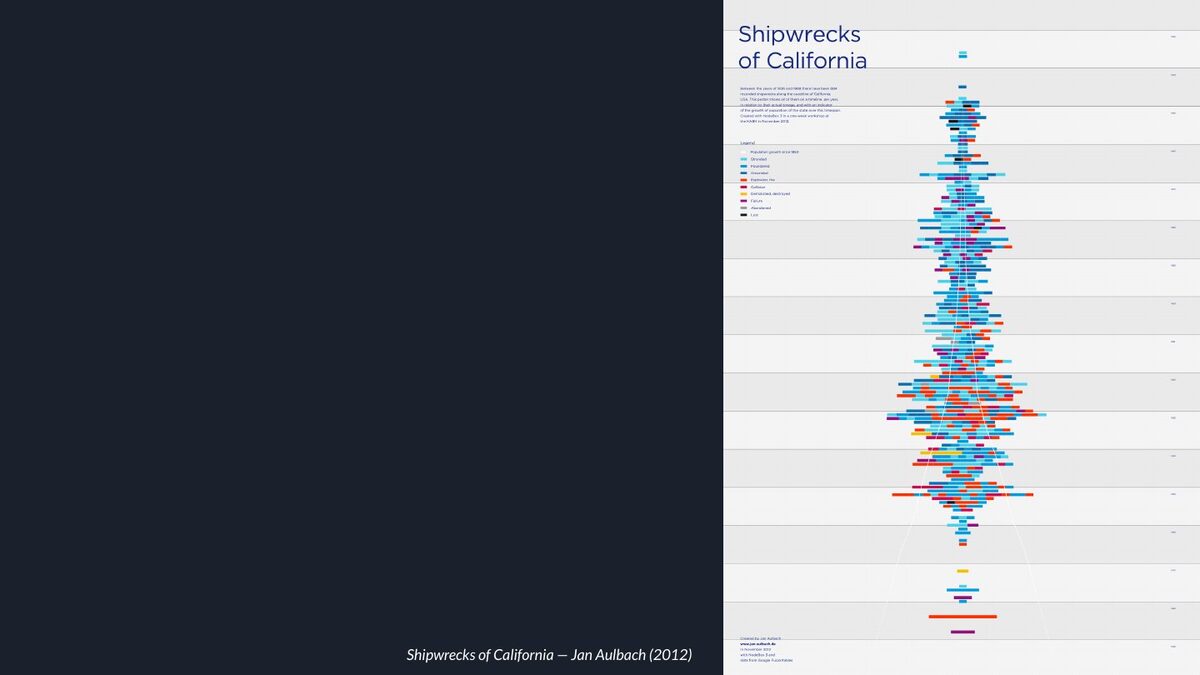
Jan Aulbach made Shipwrecks of California in a data visualisation workshop we gave in The Hague. It is a timeline of the ships that wrecked off the Californian coast, each sized by its tonnage. In the early years there are many wrecks as maritime traffic grows. Later, safety improves and wrecks become rare, but when one happens it is a much bigger ship.
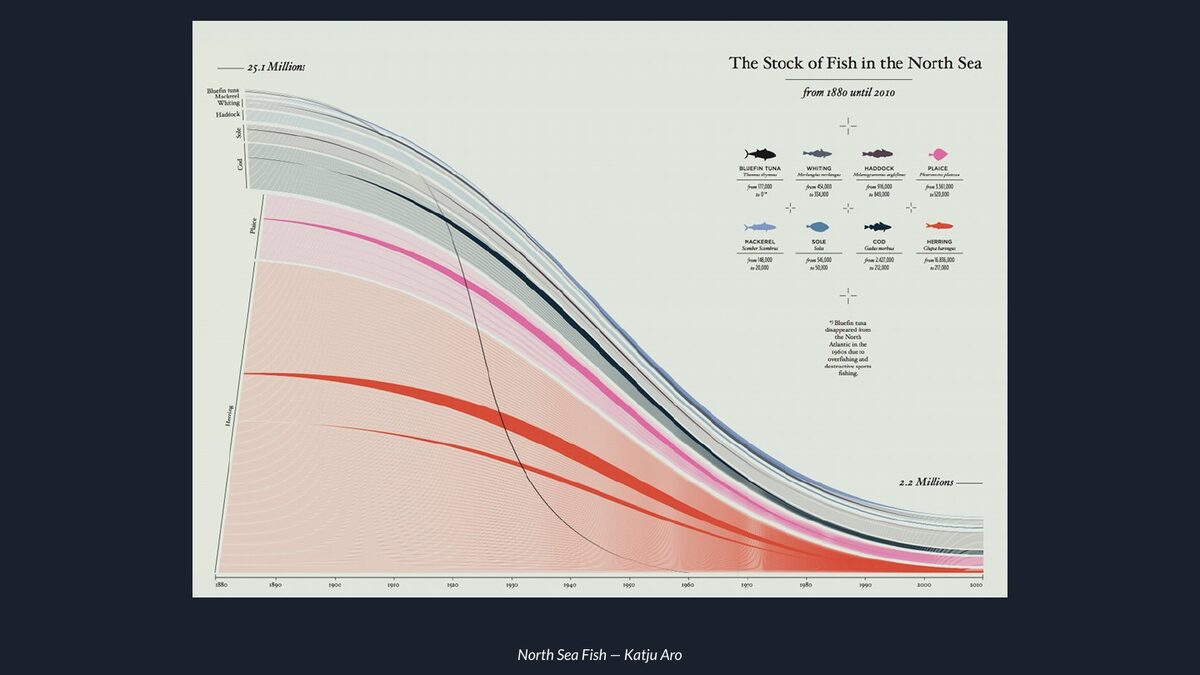
Katju Aro visualised the declining stock of fish in the North Sea, with a colour for each species. It is a dramatic picture: nearly every band goes down.
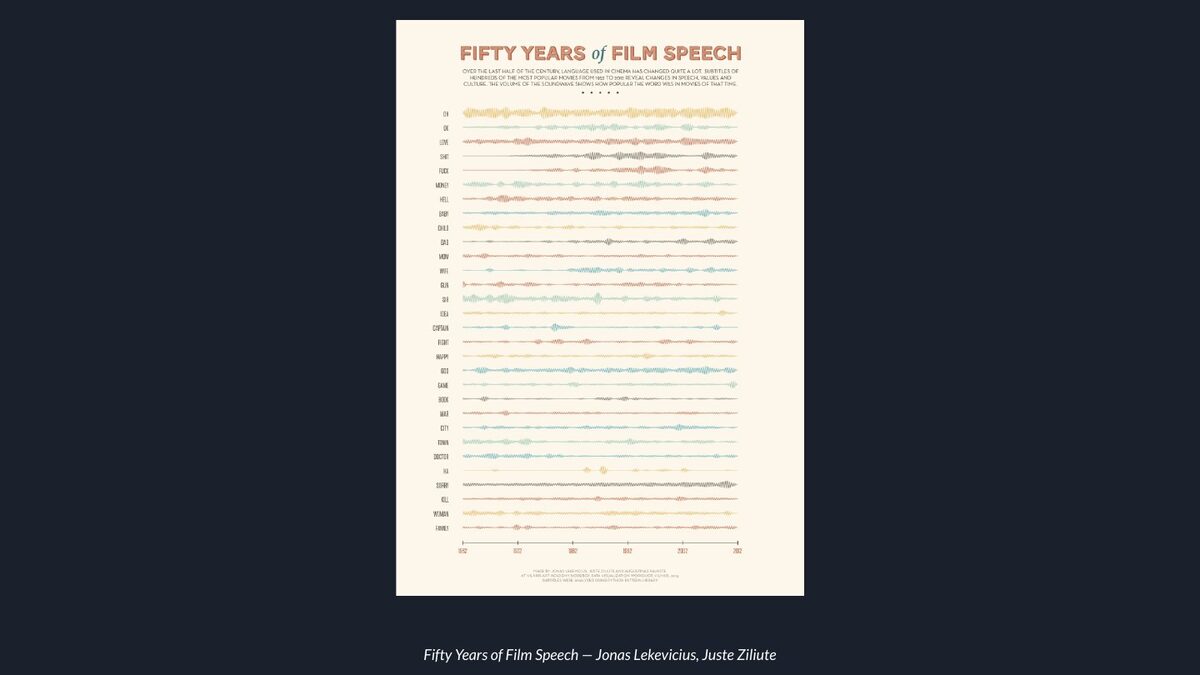
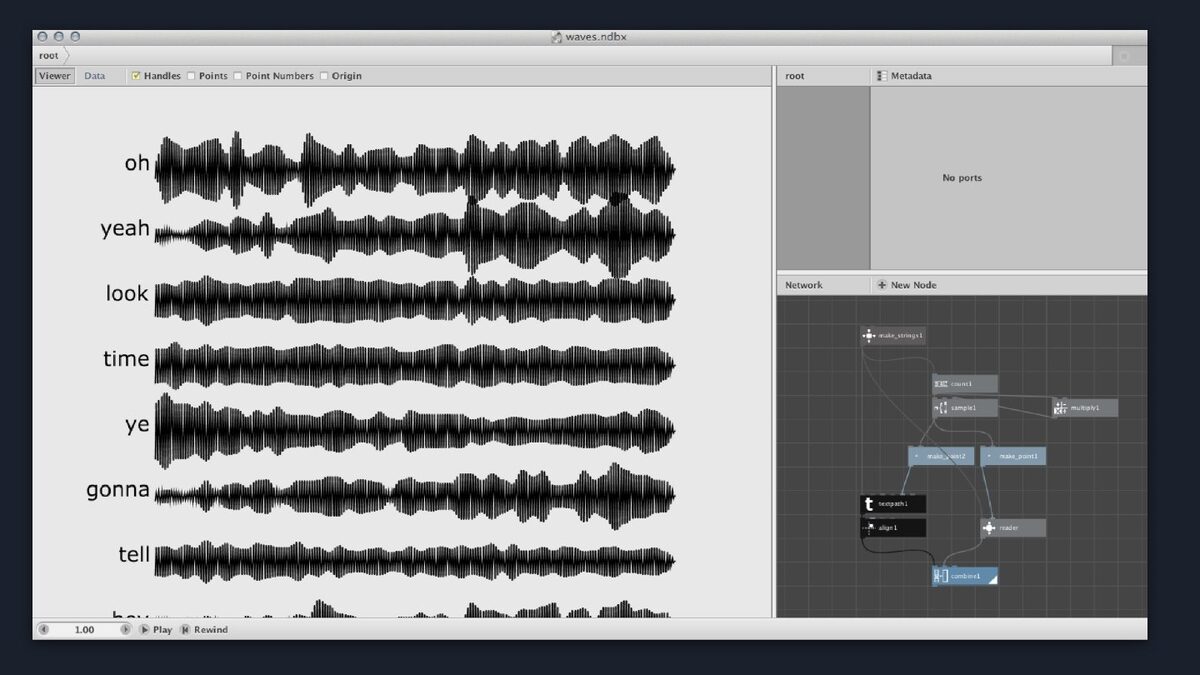
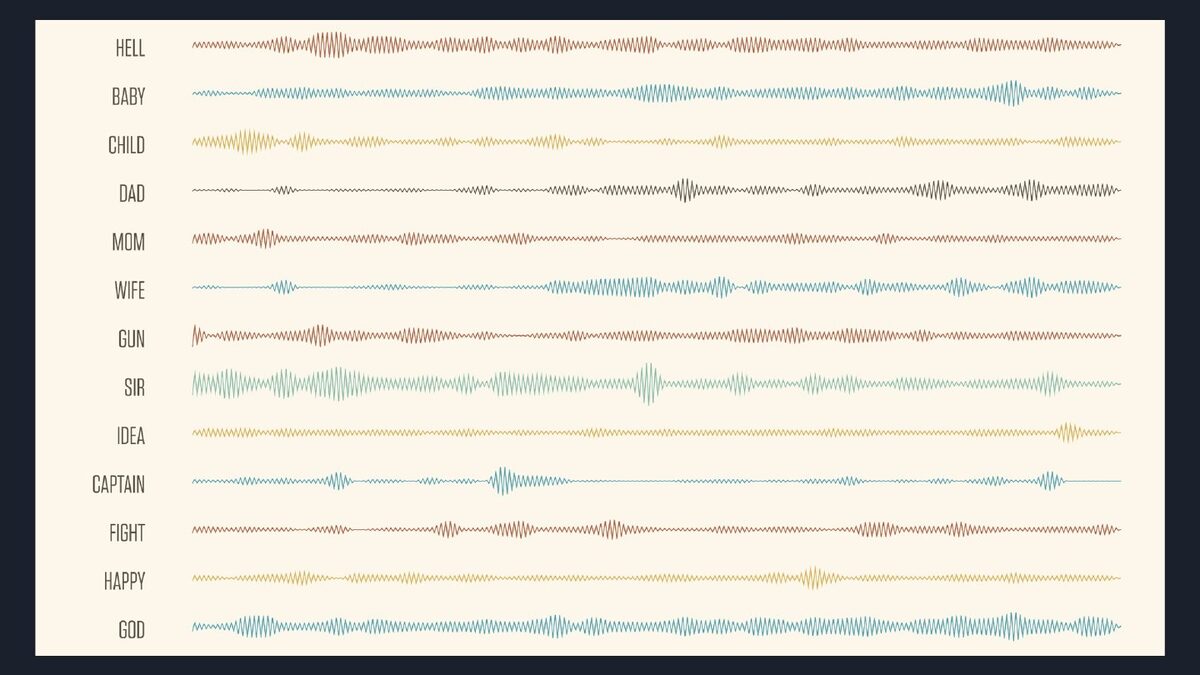
Fifty Years of Film Speech by Jonas Lekevicius and Juste Ziliute is one of my favourites because it brings everything together. They took the subtitles of the fifty most popular films of each year, over fifty years, and kept the fifty most frequent words. For every word they drew a sound wave that shows how often it is spoken over time.
A lot of data preparation happened before the data reached NodeBox. Not everything can be done inside it.

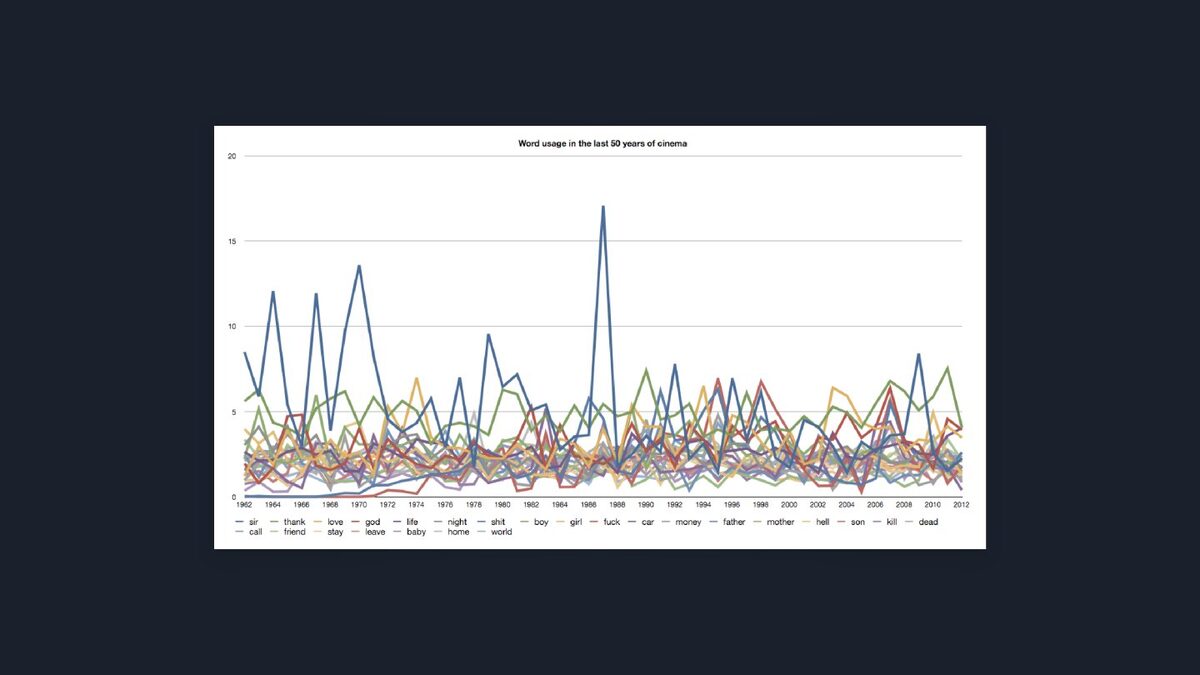
If you put the raw data into Excel with every word on top of each other, you get the chart on the top right. That is a bit unfair to Excel; you would use small multiples instead.
NodeBox let them build their own visualisation, a sound-wave shape, which suits a project about speech. Like the evilness slider, the sound wave is a custom node: a small network packaged as a single node. You attach data to it and the shape comes out. The last image is a close-up of the words changing over time.
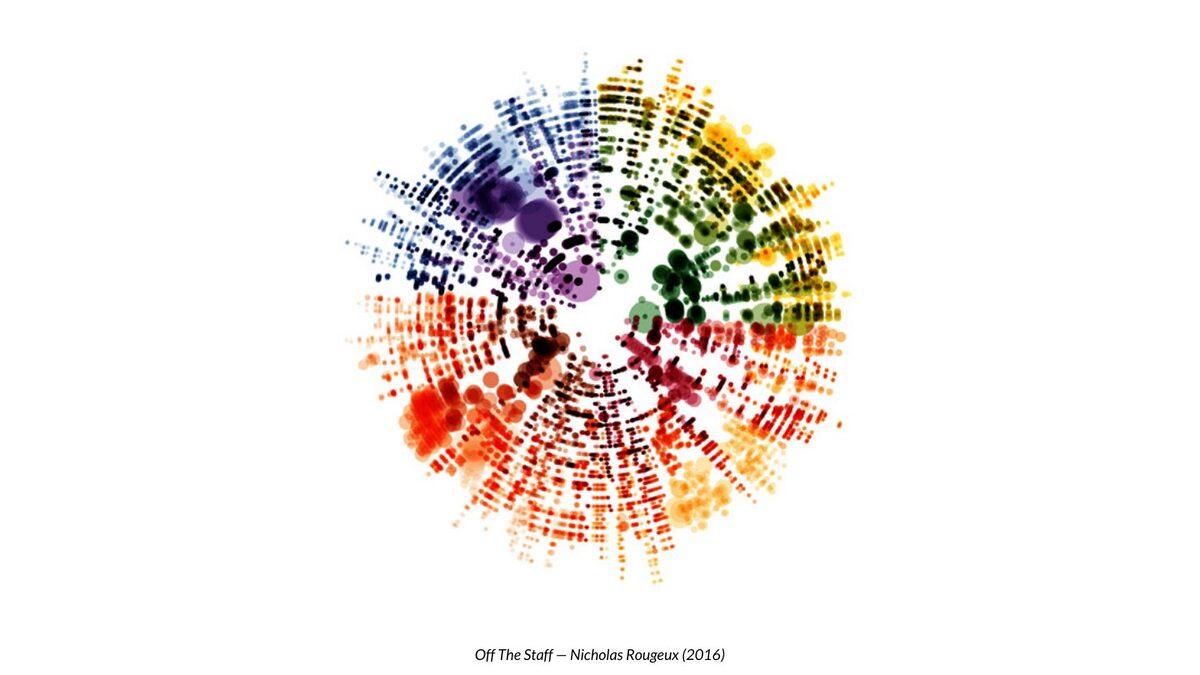
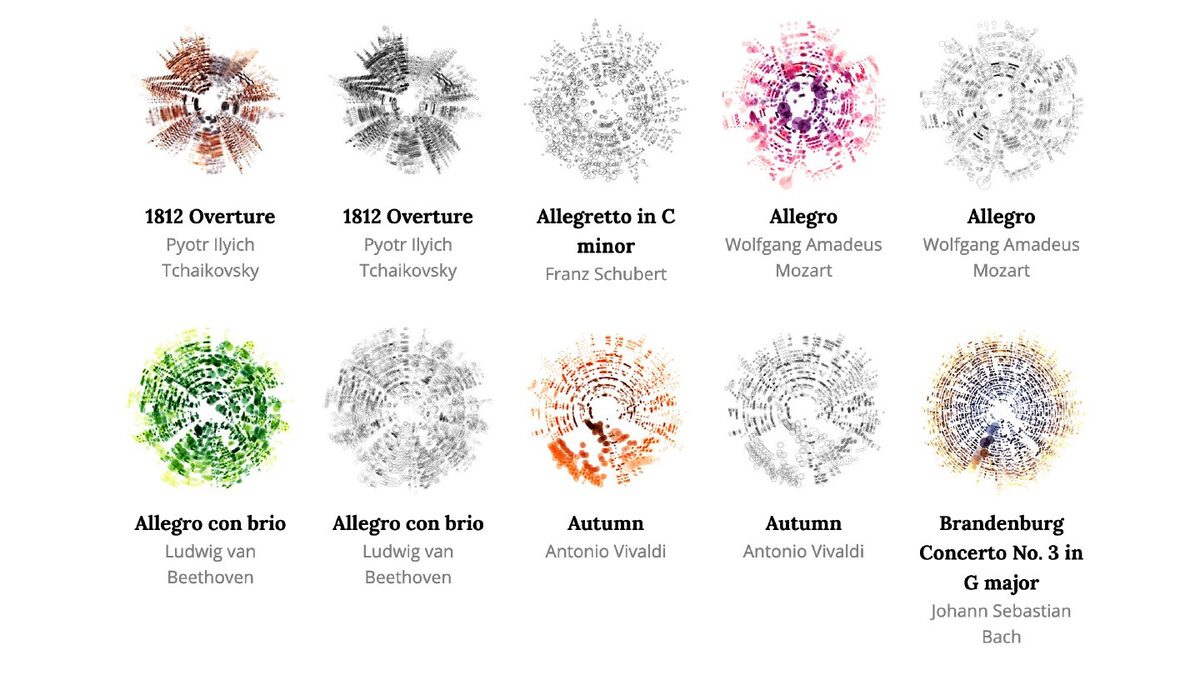
Nicholas Rougeux visualises musical scores in a series called Off the Staff. Each image is a whole piece: Tchaikovsky's 1812 Overture, Vivaldi's Autumn, a Brandenburg Concerto. He uses NodeBox among other tools, and he writes about his process, which shows that NodeBox gets used outside the classroom too.
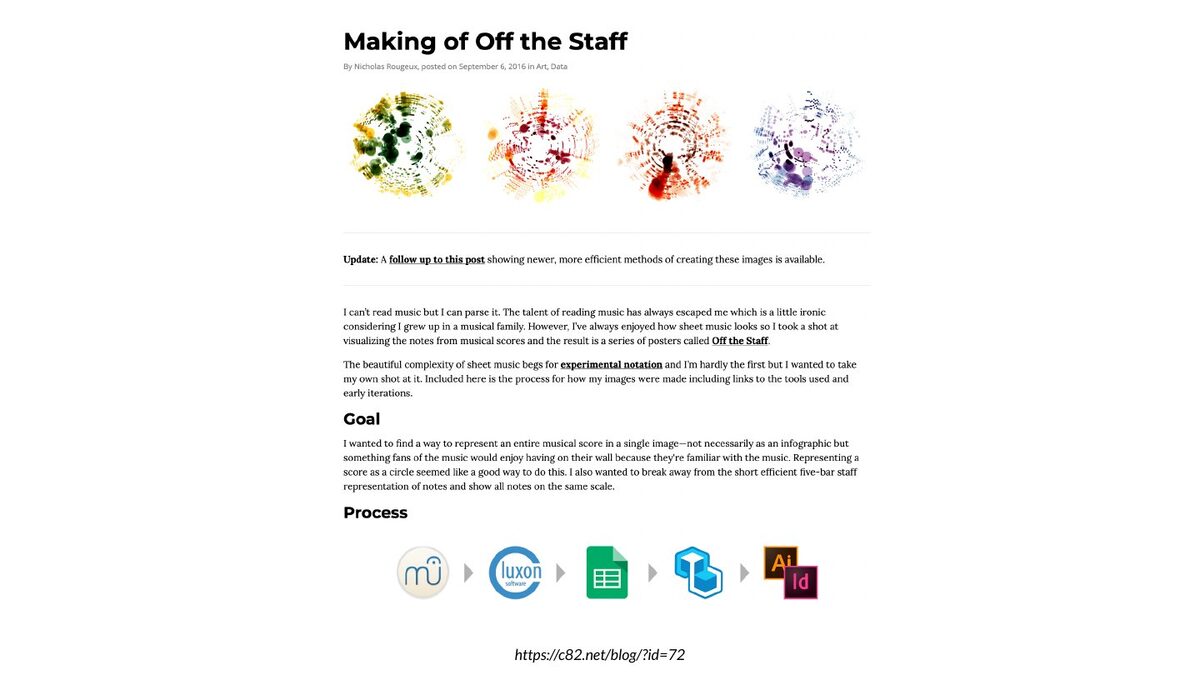
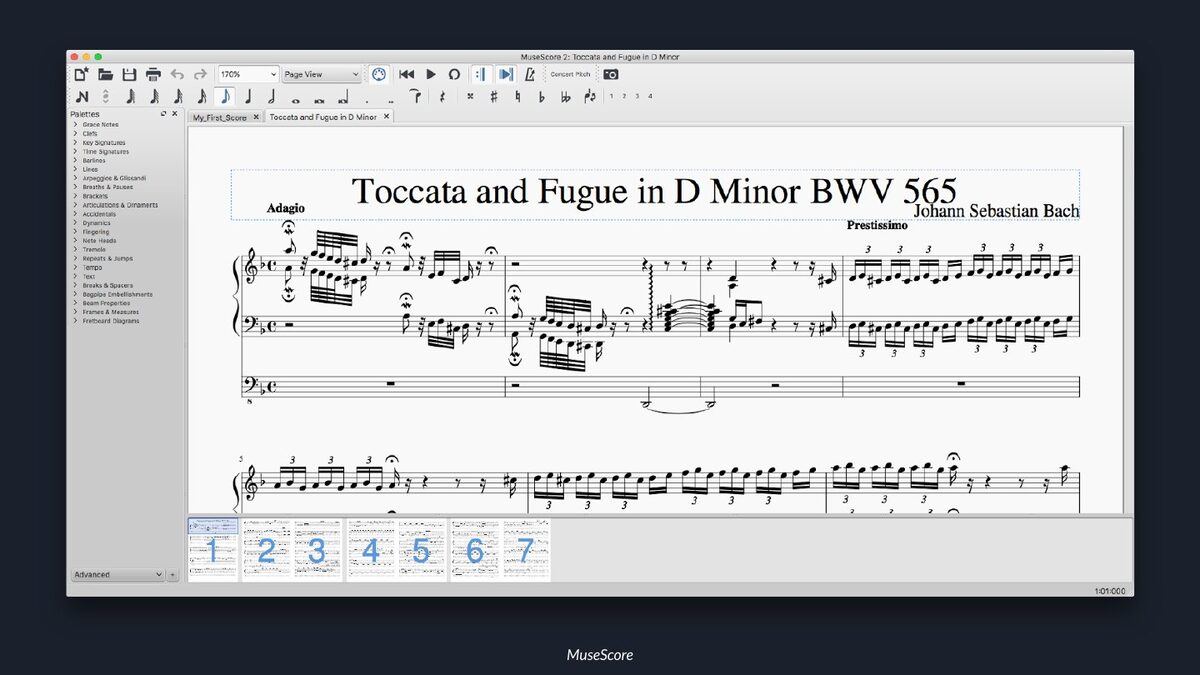
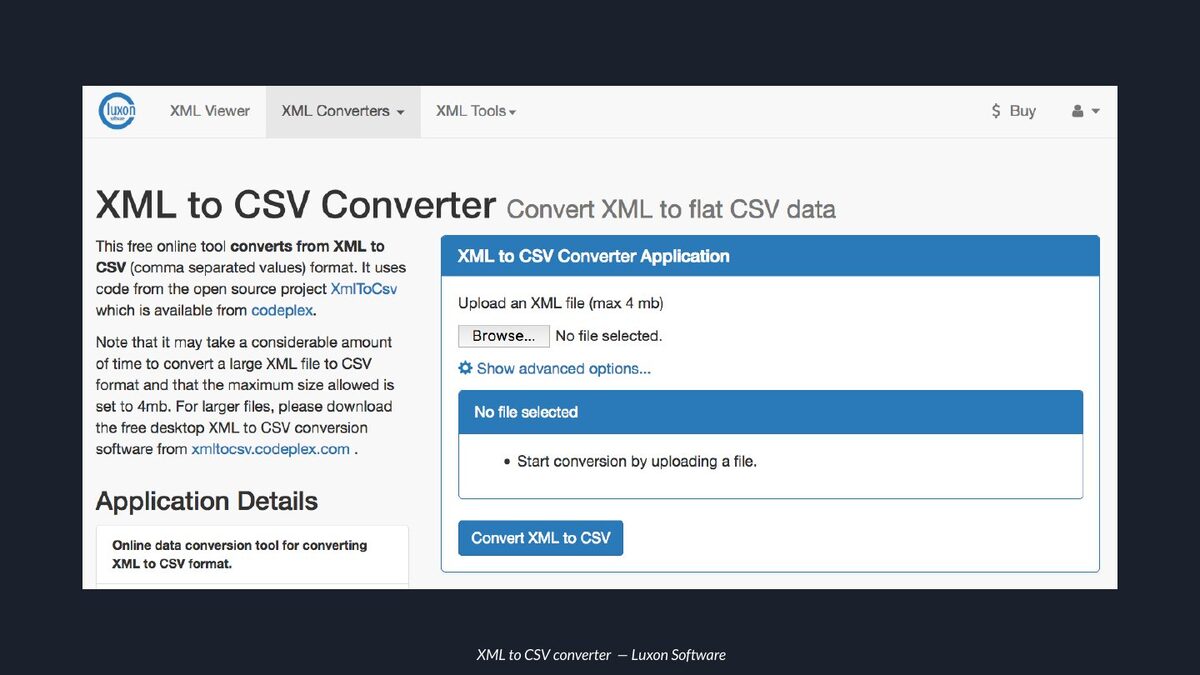
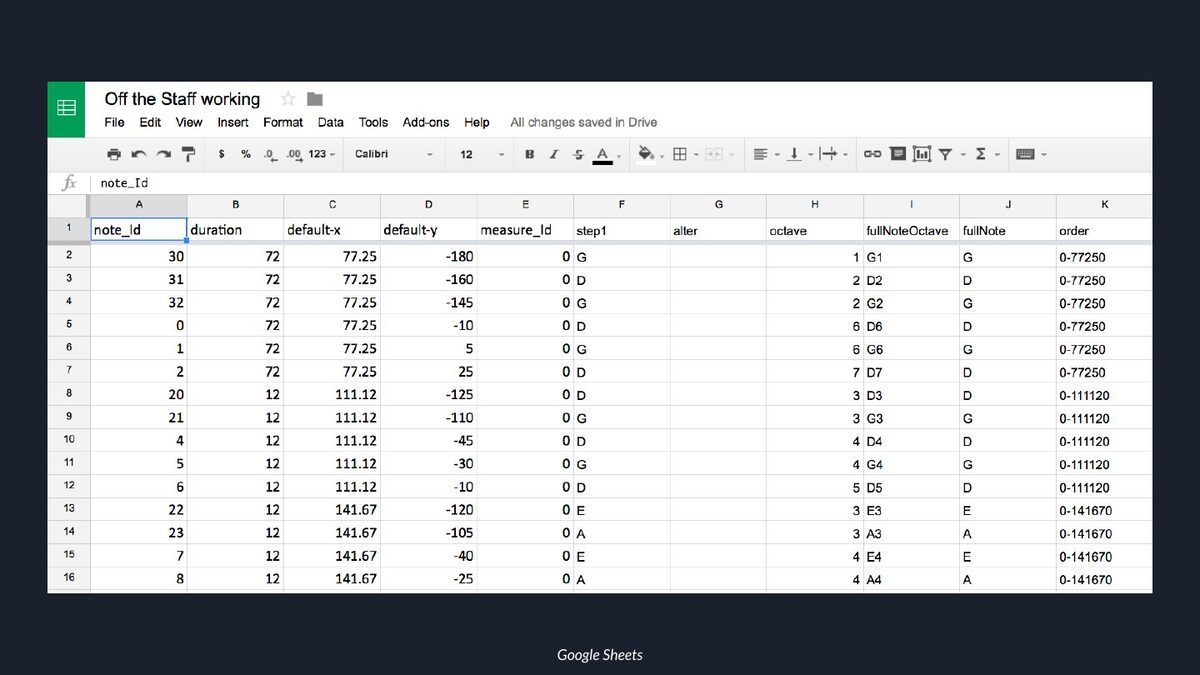
His making-of post explains every step. He opens the score in MuseScore, exports it from MIDI to MusicXML, converts the XML to CSV, and cleans it up in Google Sheets, because no data visualisation project is finished without a spreadsheet. Then it goes into NodeBox.
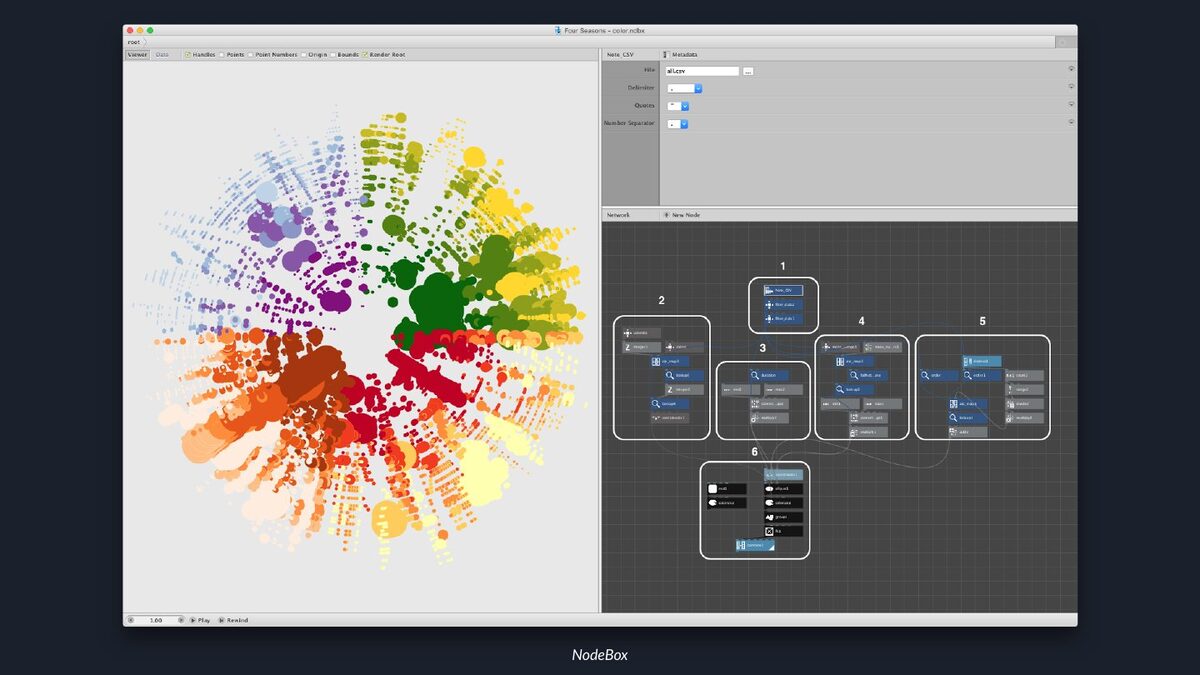
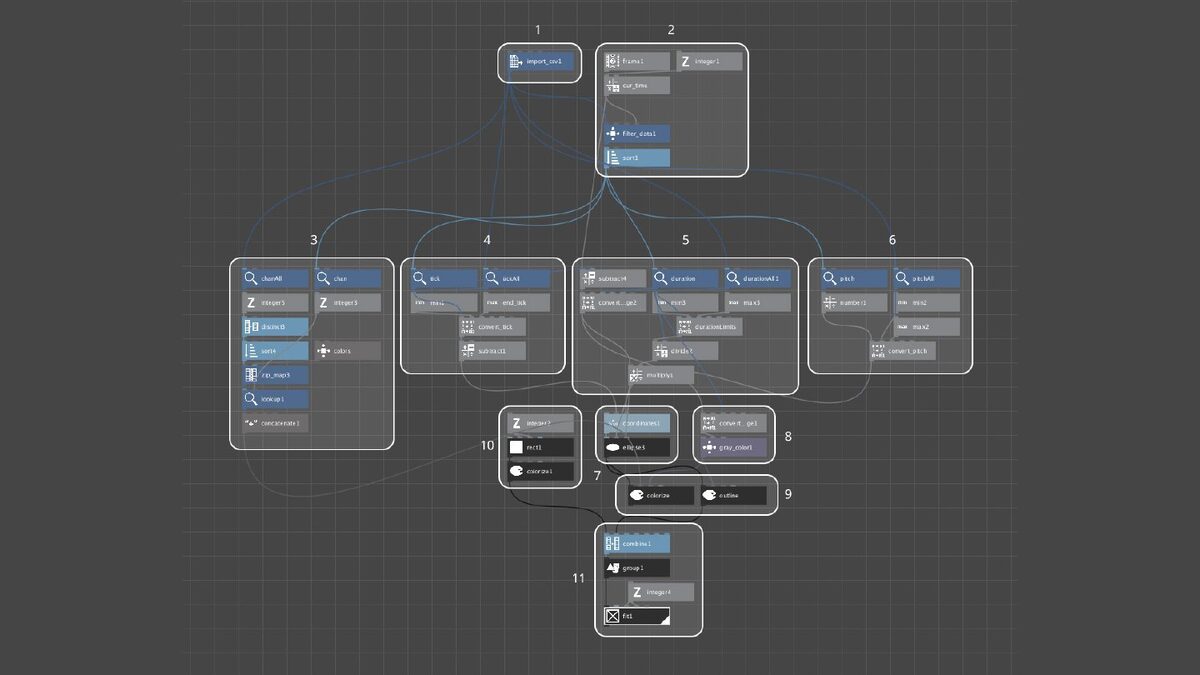
He numbered the parts of his network, which makes it a good illustration of the model I described. It starts by importing the CSV. The blue nodes process the data. They compute the current time from the frame number (NodeBox renders video at 30 frames per second and the data is in seconds), a colour per instrument, an angle starting at twelve o'clock, a circle size from the note's duration, and a distance from the centre from its pitch and octave.
From step 10 the nodes turn dark. Those are visual nodes, where numbers become shapes. A rect node, for example, has four input ports for x, y, width and height, and what it draws depends on what you connect to each.
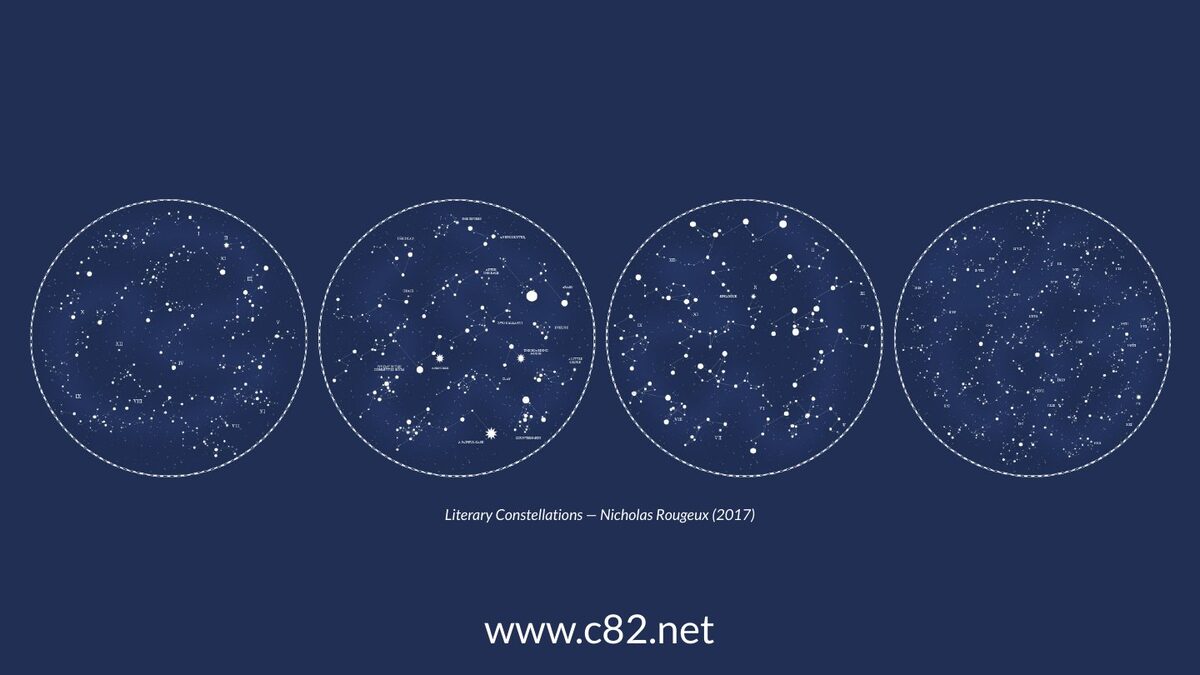
There is much more on his site, c82.net, such as Literary Constellations (2017).
List matching
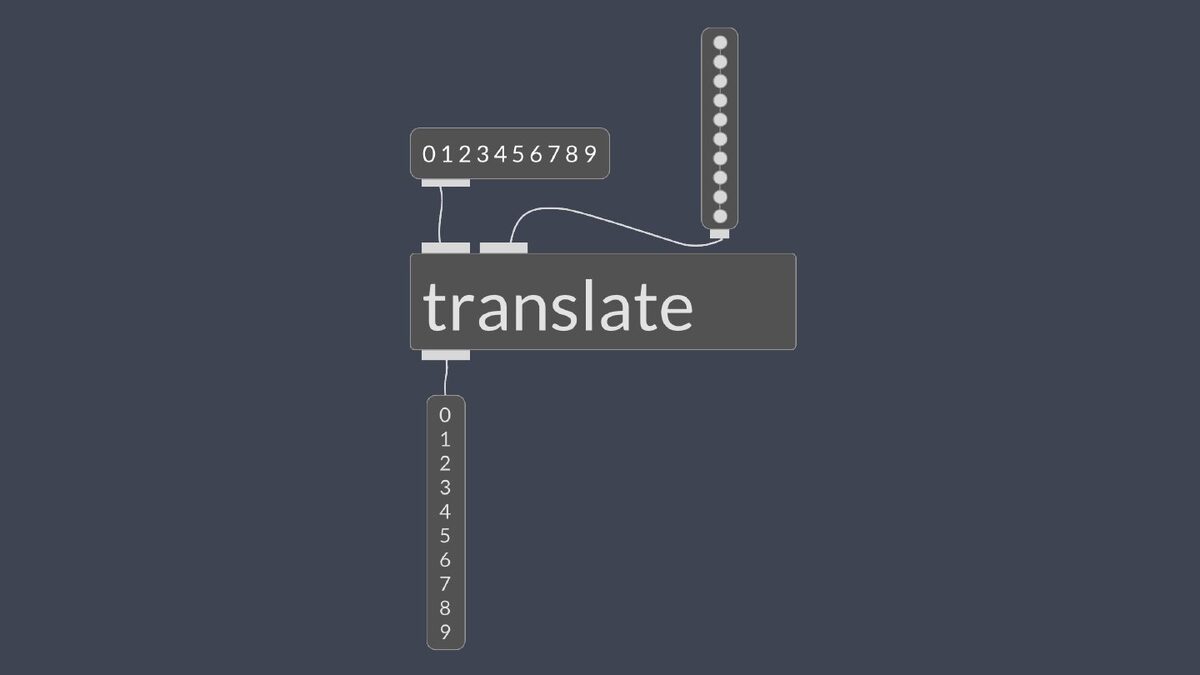
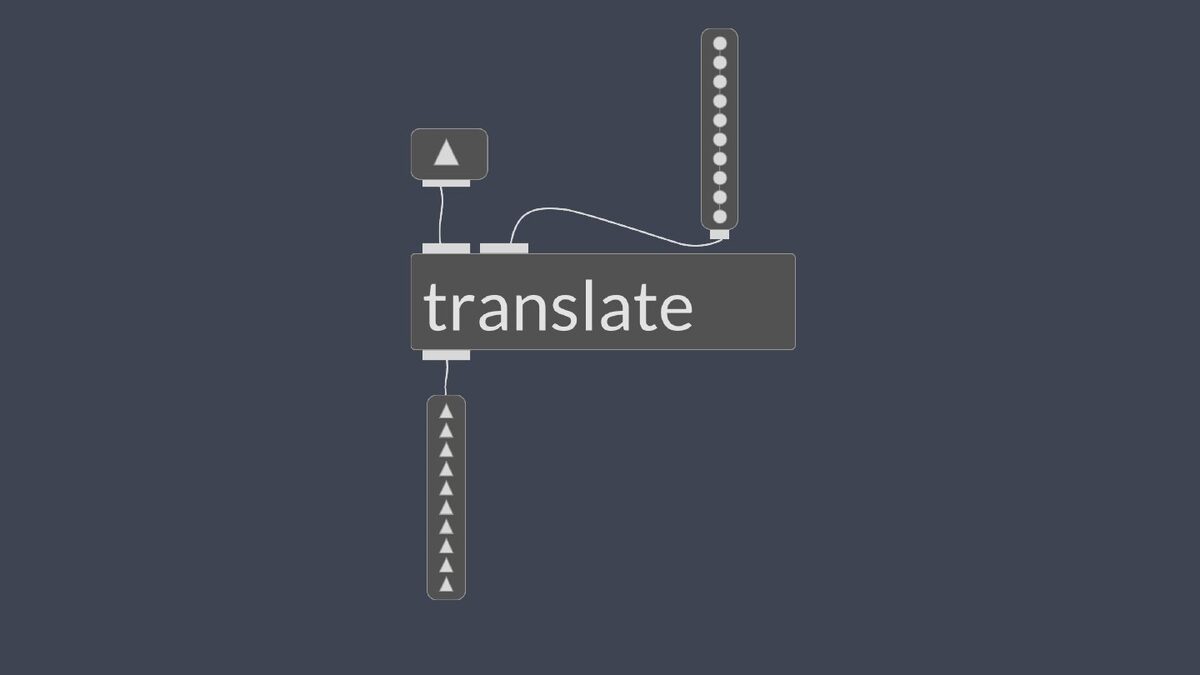
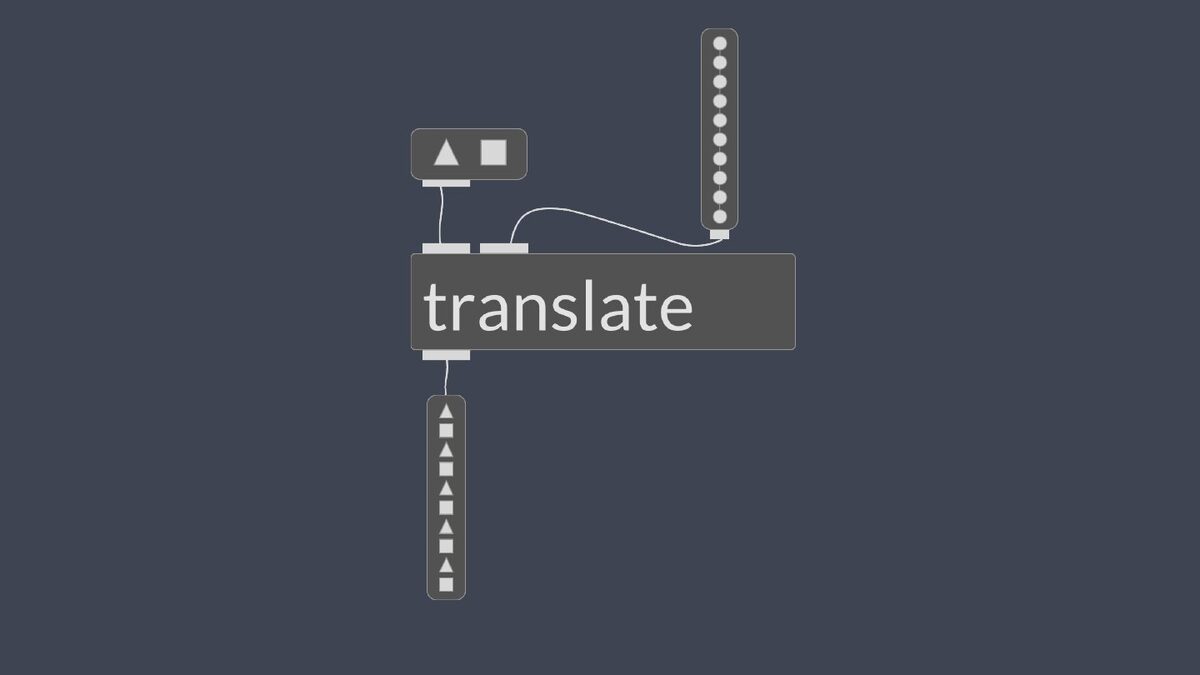
All these examples work on many data points, so where are the loops? NodeBox behaves like a functional programming language. There are no explicit loops; NodeBox loops over everything implicitly, using a system we call list matching.
When a node gets two lists, it pairs them element by element. Say the dots are positions and the numbers are data: the first number goes to the first dot, the second to the second, and so on.
If one list has a single element and the other has many, the single element is repeated. With other lengths, such as two shapes and ten positions, the shorter list wraps around and the shapes alternate. The output is as long as the longest list.
This works well in practice, and it makes it easy to see what every node is doing.
Visual debugging
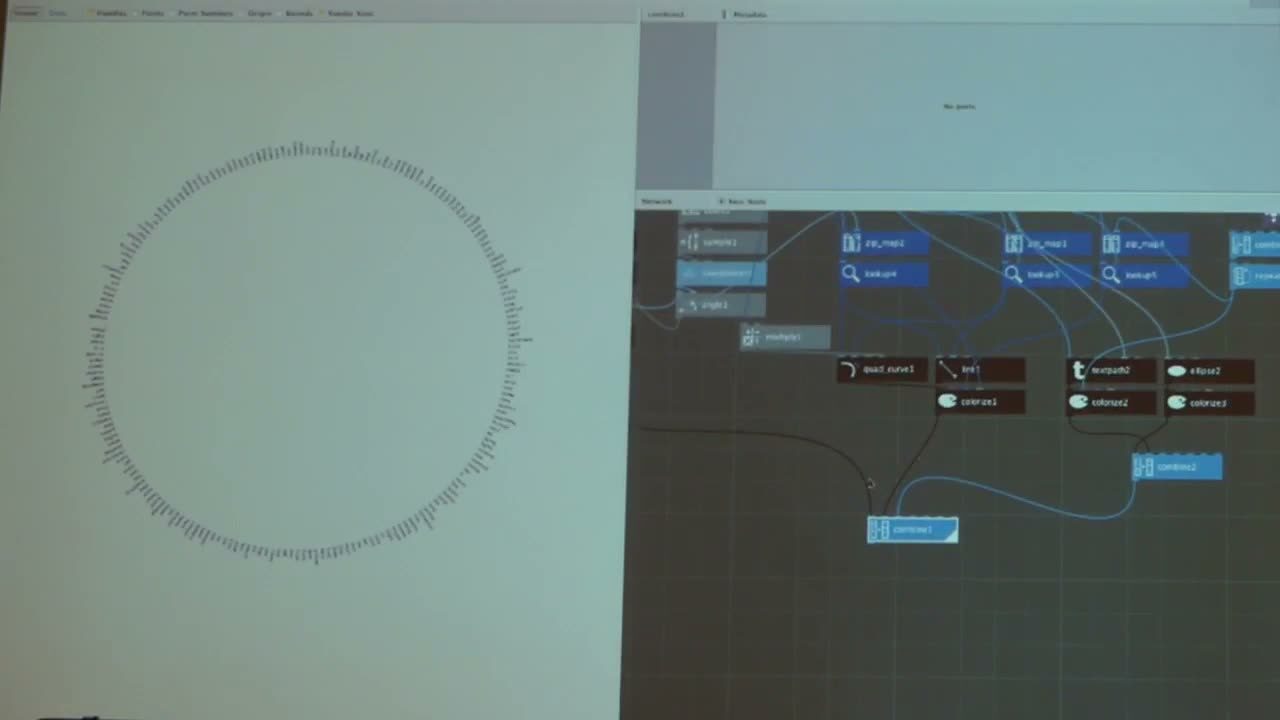
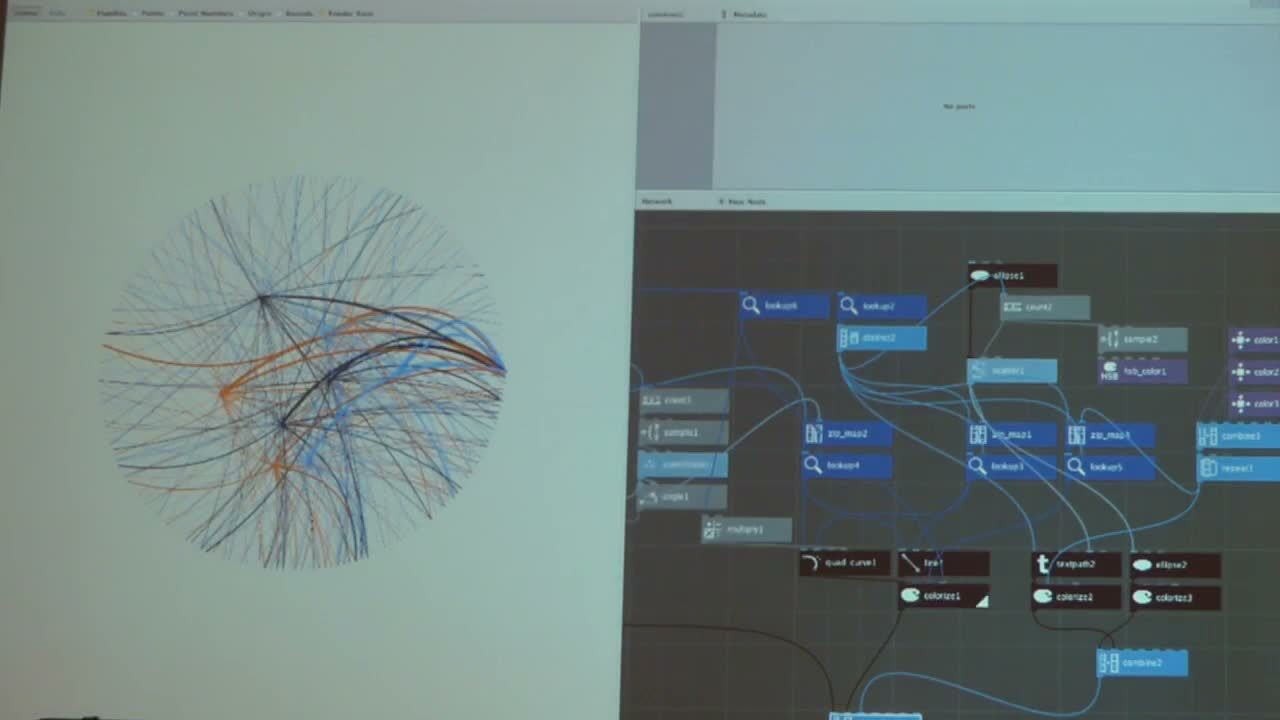
Because every node does something concrete, you can always check where things go wrong. We use this when teaching: once students know a bit of NodeBox, we ask them to swap computers with the person next to them and break their network. Then everyone has to find the bug in their own.
In the demo I opened a network that visualises the words used across all Metallica albums. I expected lines inside the circle and saw none. The viewer shows the output of the node at the bottom, a combine node that merges everything. I clicked my way up through the network. The text around the circle was fine, but the coloured lines were missing. Further up, a lookup node that should have returned the list of albums returned nothing, because of a mistake in its settings. After fixing it, I stepped back down node by node, checked the lines, the colours and the combine, and the visualisation appeared.
In an imperative program with loops, a mistake somewhere in the middle is hard to locate. In NodeBox you go up the network one node at a time, compare the data you see with the data you expect, and find the node where they differ.
NodeBox Live
NodeBox 3 works well, but it cannot do anything interactive. About two years before the talk we made NodeBox Live, which brings the same model to the web.
This demo builds a dashboard widget from tweets about telecom operators. Here they are imported from a file, but NodeBox Live also supports real-time data streams. A scale node maps the earliest and latest dates to pixels, those become points, and the port you connect them to decides whether they drive x or y. A sentiment analysis library splits the tweets into positive and negative. We turn them into ellipses, colour them, add a legend and combine everything.
To put it on a dashboard, we make it smaller, copy a snippet of iframe code and paste it into the dashboard page. The embed stays live, so you can keep adjusting it afterwards. Because the network is a procedure, you can point it at the data of another operator. The other charts on the dashboard, such as the word cloud, are NodeBox Live networks too.
On the web you get everything the web offers, including interactivity, and I like to mix the serious work with less serious student projects. Quinten De Meester was fascinated by how slow the revolving doors in shopping centres are, and wondered what would happen if you could change their parameters.
His Raging Revolving Door (2015) lets you set the motor speed, how fast people walk, and how many of them there are, like a busy shopping season versus a normal day. Then you can turn everything up and watch.
De Standaard
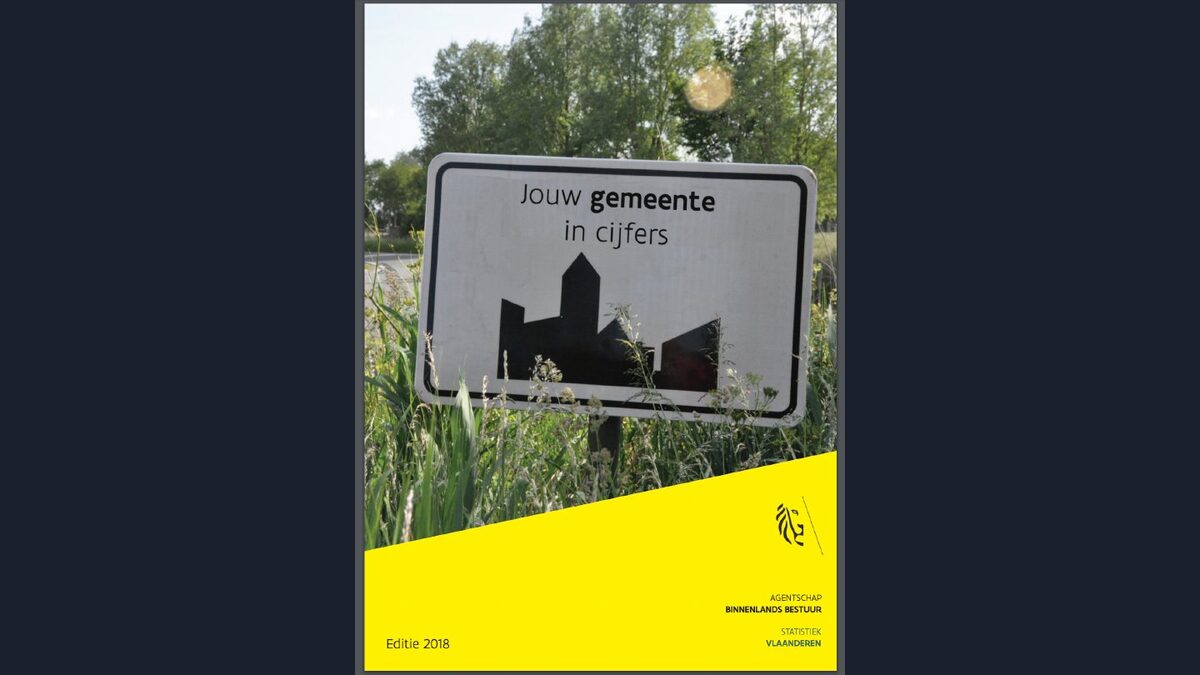
Because we work in an academic context, we have to think about how NodeBox can sustain itself, and a commercial version is one option. So we worked with De Standaard on Jouw gemeente in cijfers ("your municipality in numbers"), a large dataset the Flemish government publishes about every municipality.
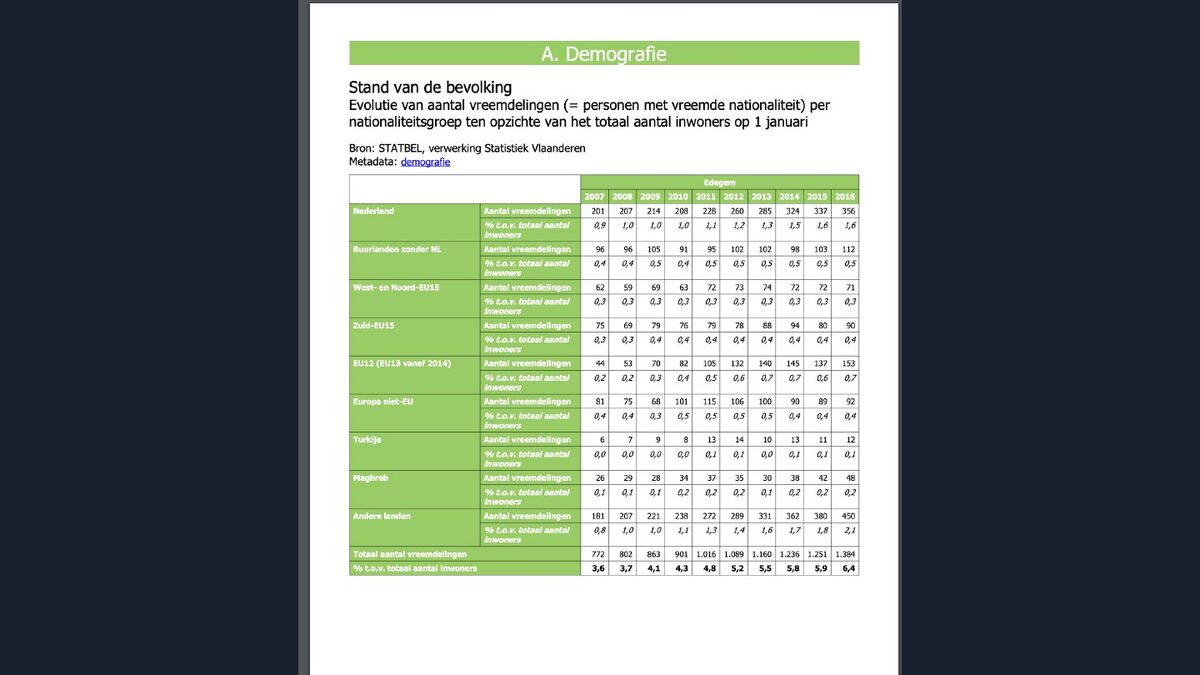
We knew the format in advance but not the data, so we prepared everything and had only a few days once it came out. We worried the report would be so beautiful that we would be out of a job. This is what came out: about 150 pages of tables like this one for every municipality.
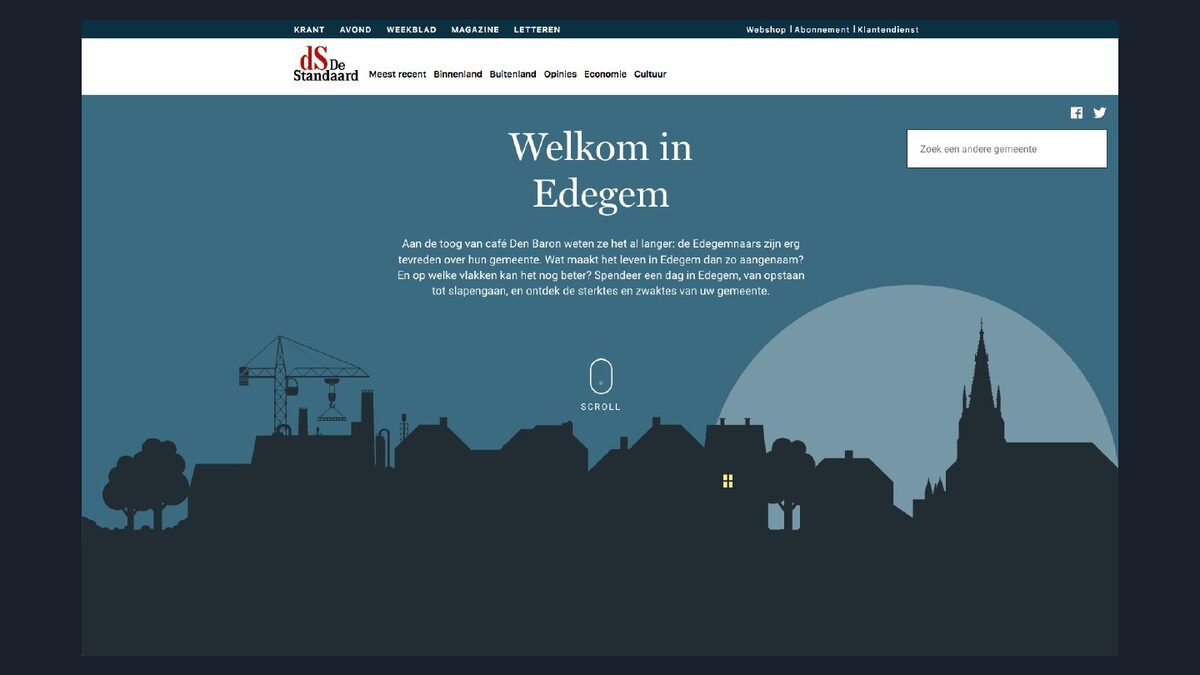
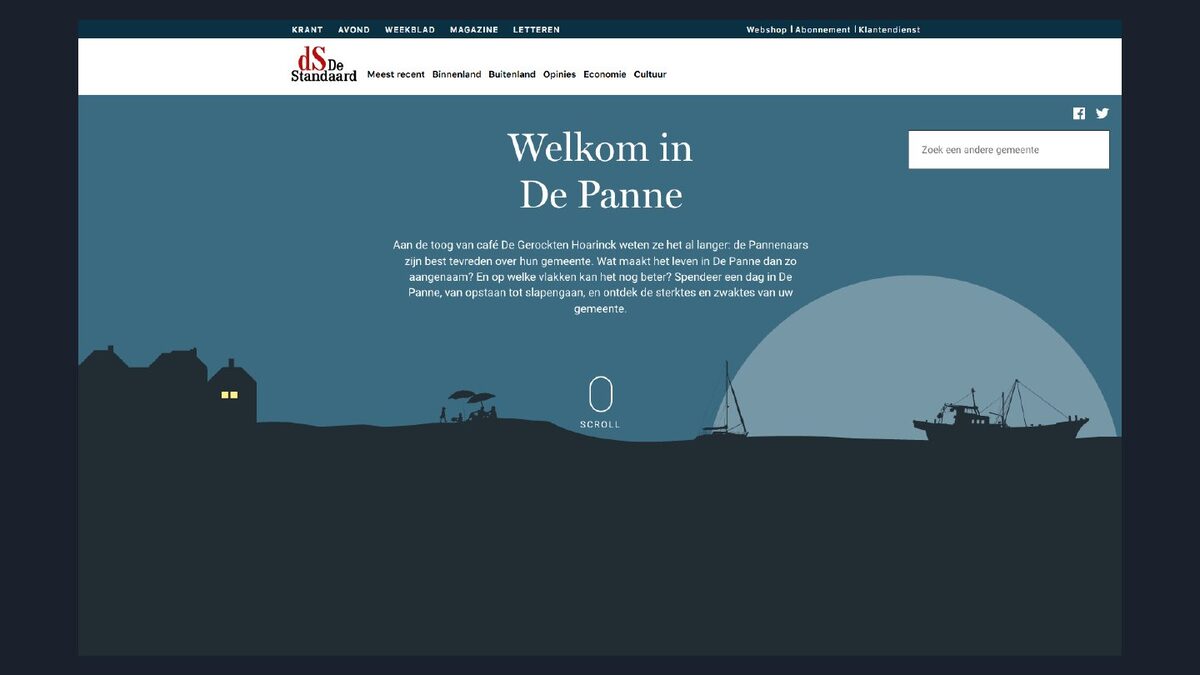
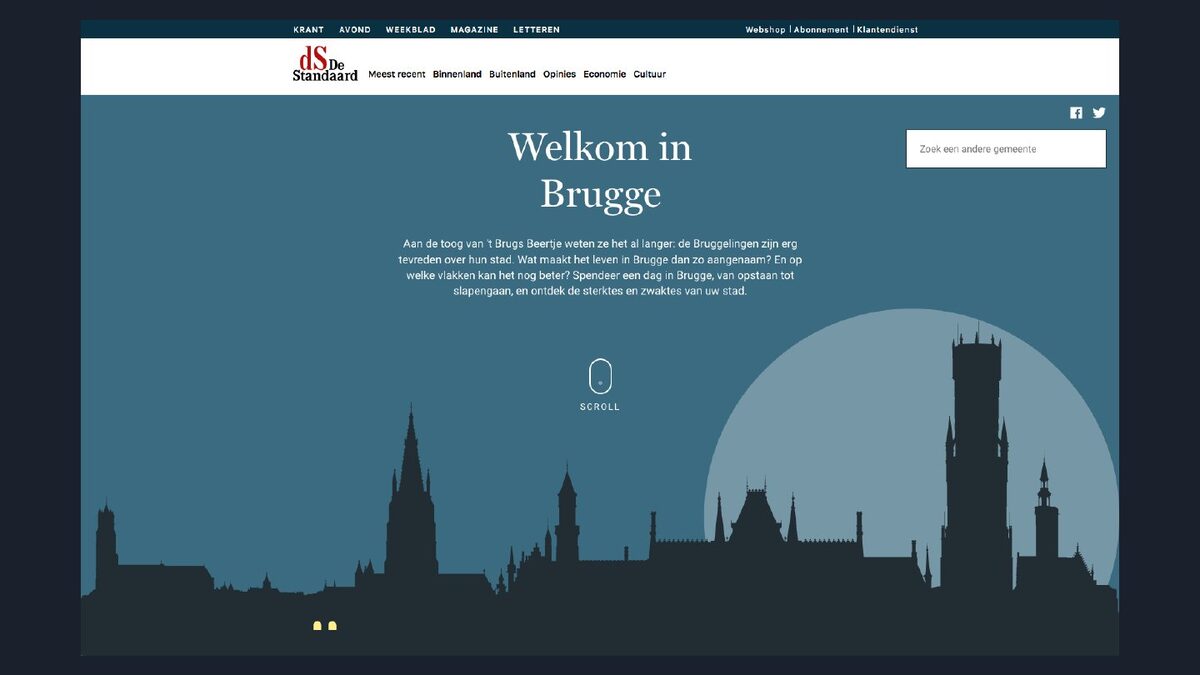
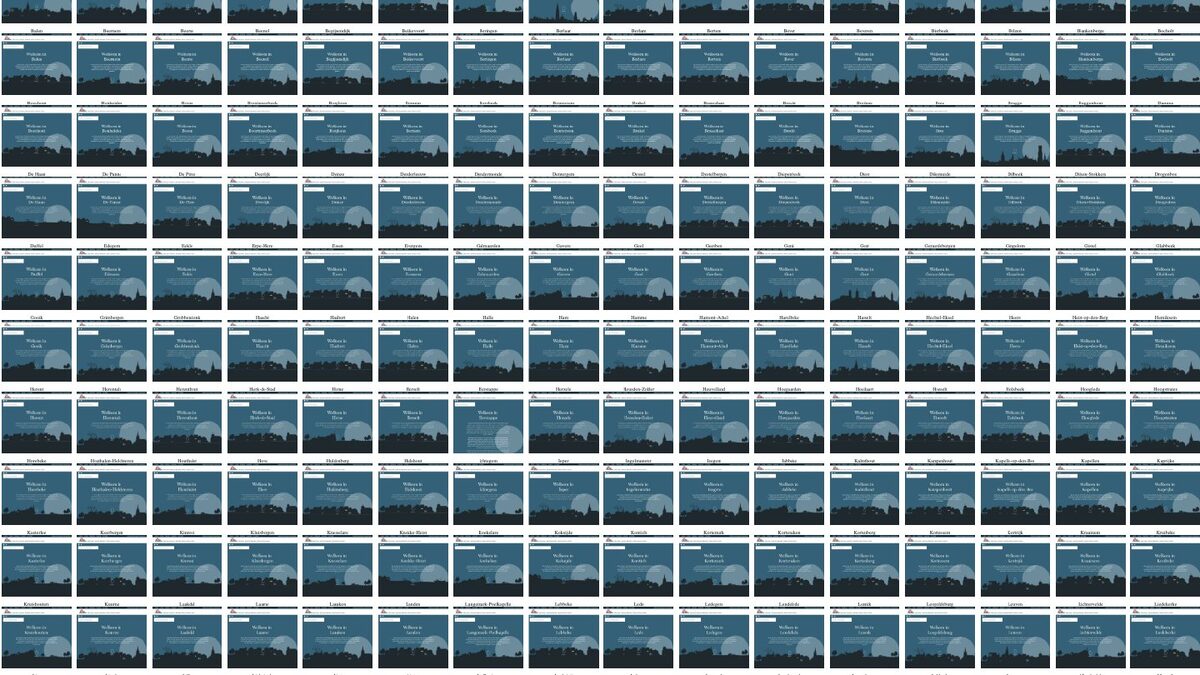
We made a day in the life of someone living in each municipality, from Edegem and De Panne to Bruges and every other one, and the illustrated skyline changes with the place.
NodeBox generated everything, including the HTML and the text. It has nodes for working with text, so a sentence like "as for the 21,834 other inhabitants of Edegem, your day begins" comes straight out of the network.
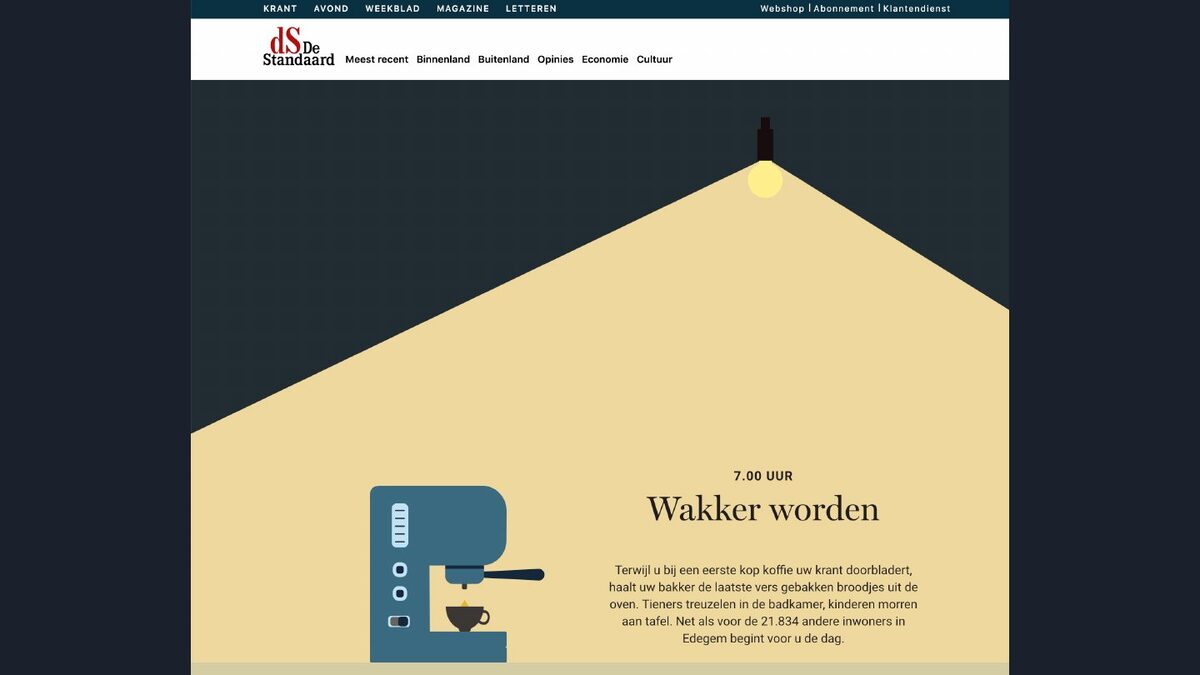
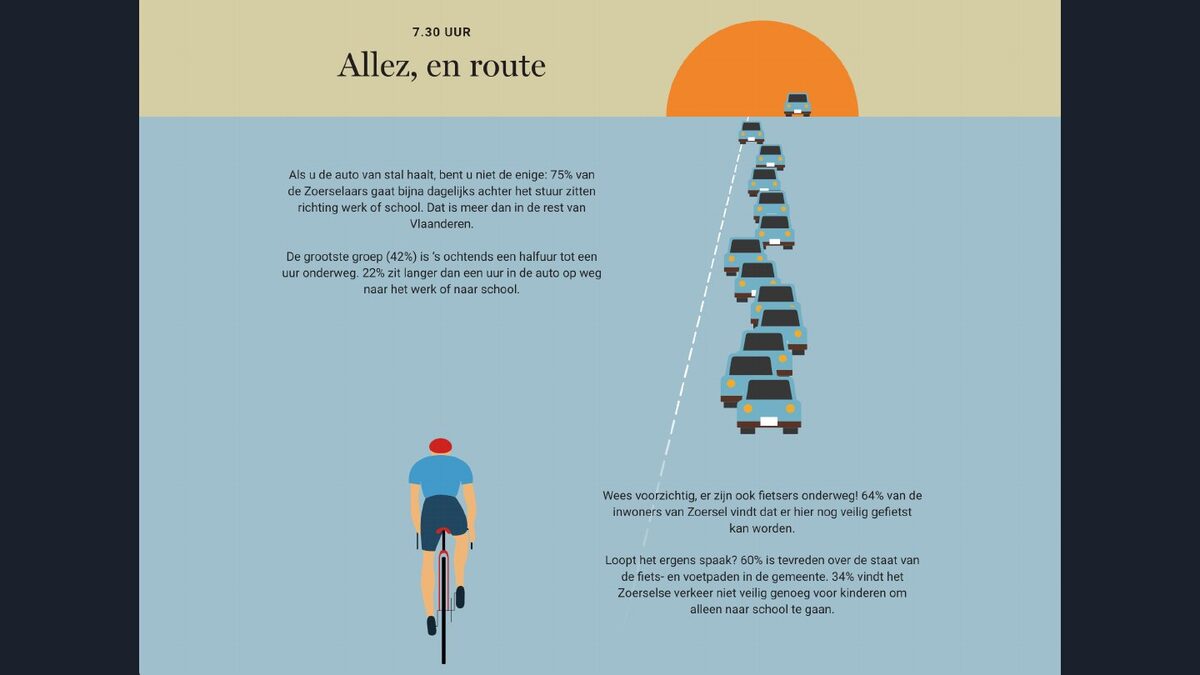
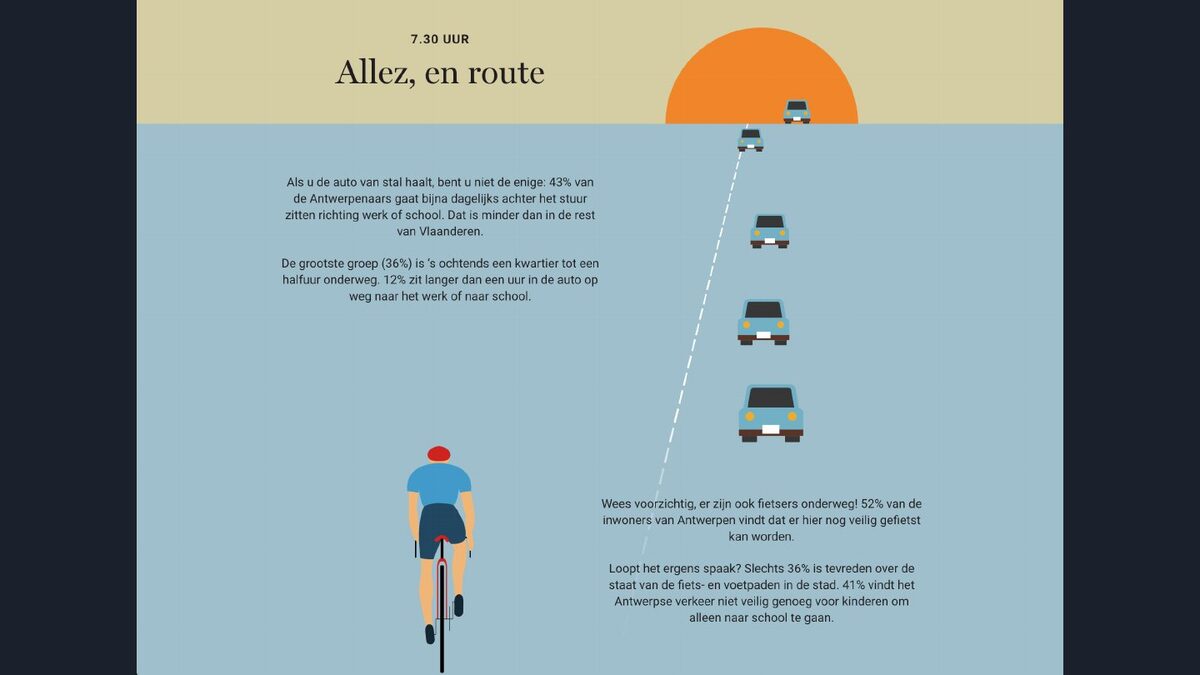
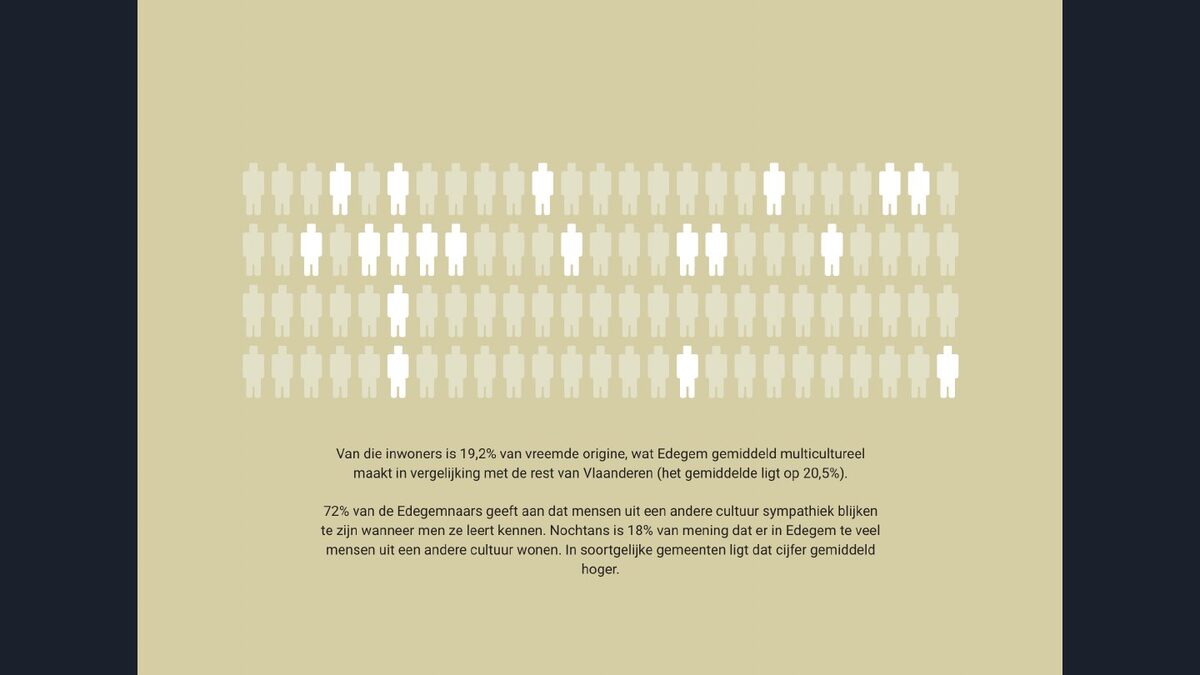
Each part of the day has its own visualisations. On the commute, the number of cars on the road follows the data: 75% of people in Zoersel drive to work or school almost every day, against 43% in Antwerp. A row of people shows the share of inhabitants of foreign origin, 19.2% in Edegem.
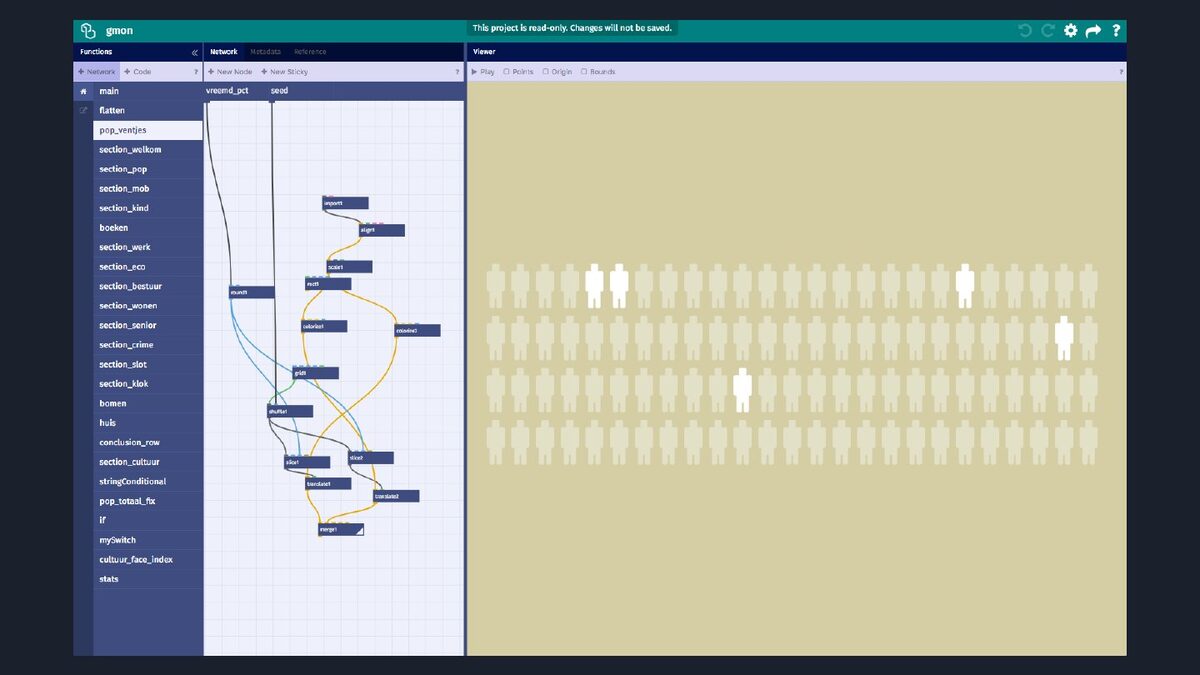
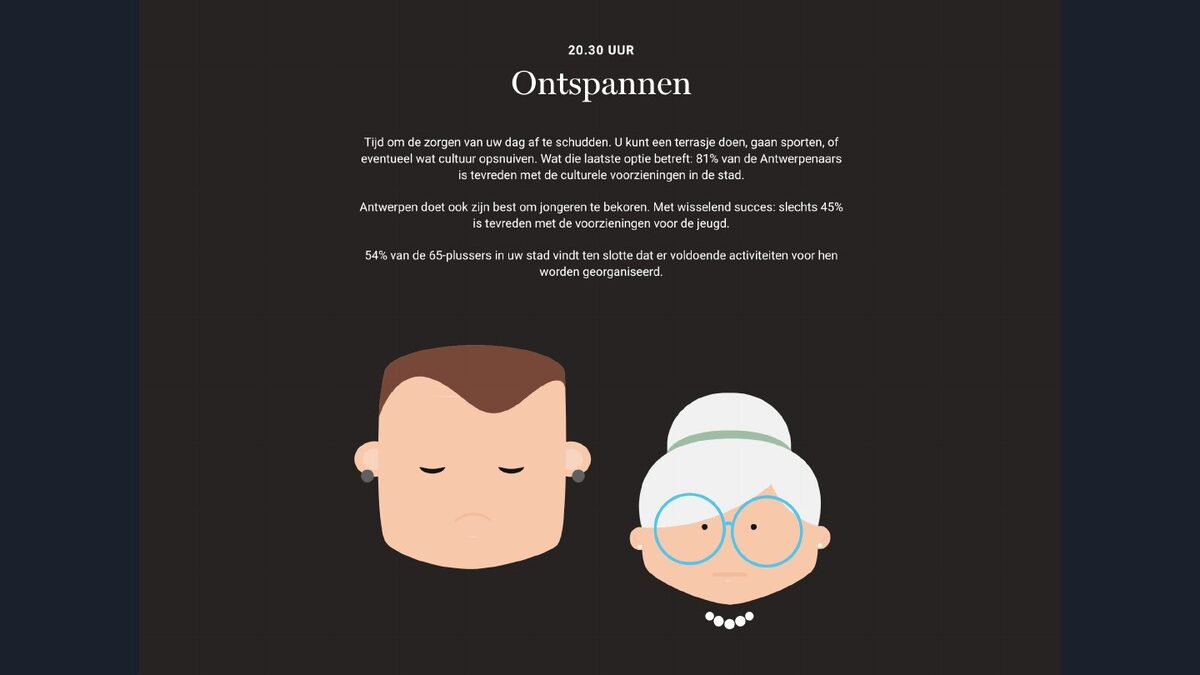
Every segment is a NodeBox Live network, and the networks are grouped together. It was a fun project, because illustrators, people working on the data and people building the visualisations all worked on the same thing.
The future of NodeBox
At the time of the talk there were two applications, NodeBox 3 and NodeBox Live. Our plan was to bring them together, with the web version as the standard and something like Electron, which Slack, GitHub Desktop and Spotify use, to run it on the desktop.
We think it matters to have a tool that is open source, freely available and supported by its community. The speaker before me argued that these tools have to last over time, and I agree. Open source means you can keep using them for as long as you need.
You can find NodeBox at nodebox.net.